Chart of the Day: Microsoft's Rare Buying Opportunity
Here's what the chart's flip-flopping is all about.
You've reached your free article limit
You've read 0 of 1 free Pro articles.
We like to say "the best trends barely ever give you a chance to get in." What this means is simply the biggest and best trends will not offer an ideal entry point and you will constantly be frustrated by your inability to buy shares.
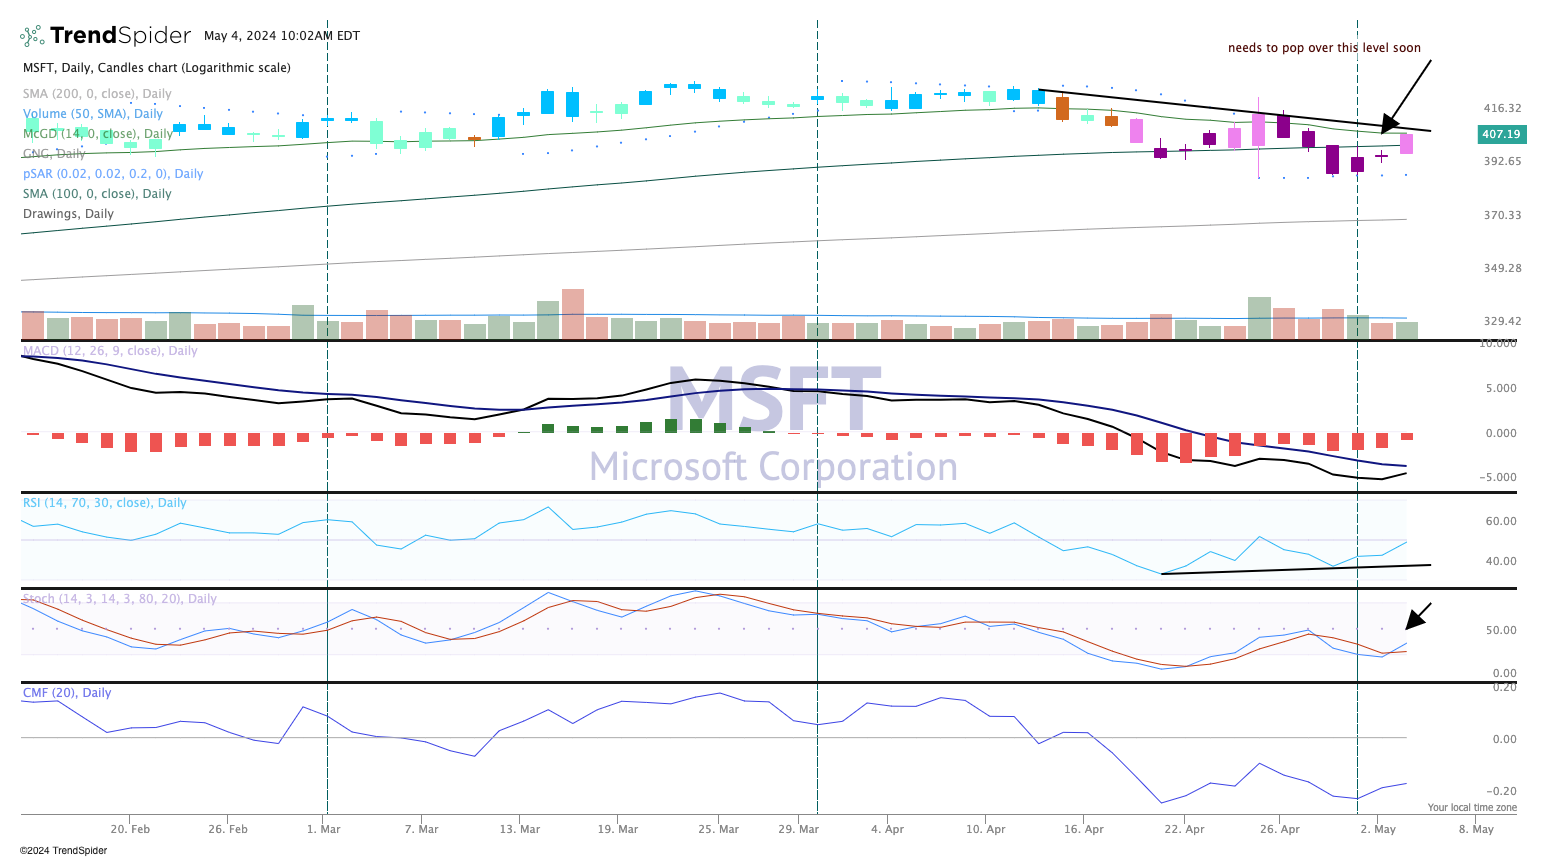
Such is often the case with Microsoft MSFT, the largest company in the world by market capitalization. The stock reported a pretty strong quarter just 10 days ago and appeared to be on its way to higher prices. But hold on a minute! The chart at the time showed the candles were flip-flopping between pink and purple. That is considered bearish on the GoNoGo composite of indicators.
Further, there is a downtrend in place of lower highs and lower lows. Until the recent high level of $424-427 is eclipsed then the best we could hope for is sideways action.
That is not a bad situation though, and considering the strength of Microsoft and how dominant they can be, this pullback could be a great opportunity to add to your holdings.
To view this chart in a separate window, click here.
The indicators are starting to turn upward. The stochastics momentum indicator in pane 4 already has done this. RSI in pane 3 is moving higher as well, but price is stymied by the 14 day McGinley (arrow). Microsoft would need to push above that level quickly to keep the momentum going.
As mentioned, this pullback could be an ideal buying opportunity. We rate Microsoft a Two in TheStreet Pro portfolio, which means stockpile on pullbacks.
At the time of publication, TheStreet Pro Portfolio was long MSFT.
