Chart of the Day: Look What's Happening at Costco
Shares of the big box club retailer have been basing for a couple of months.
You've reached your free article limit
You've read 0 of 1 free Pro articles.
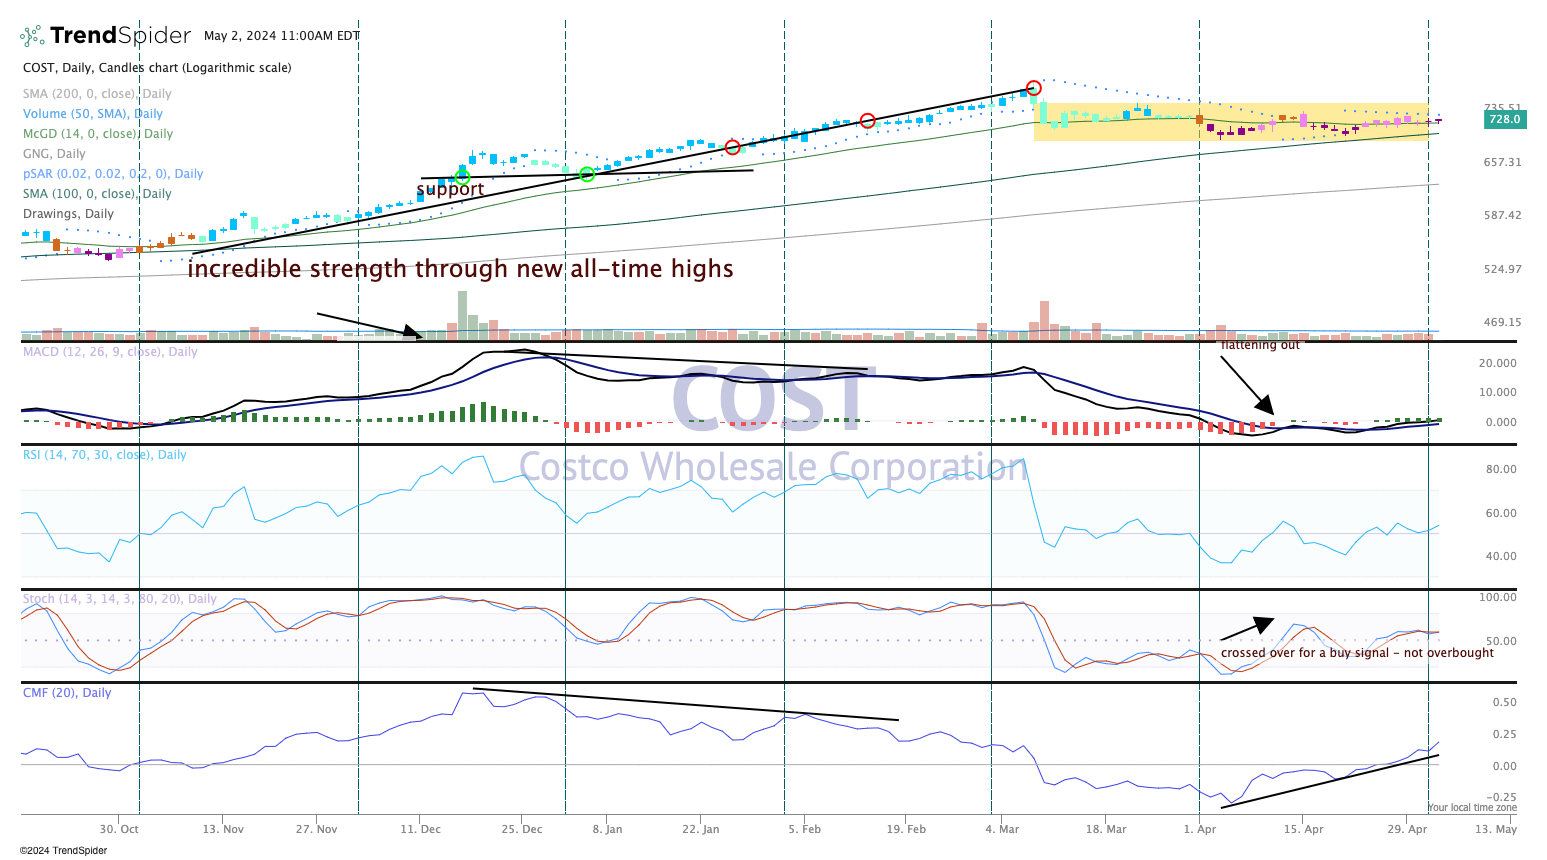
Going back to October 2022, we can see the enormous run by Costco COST, with a string of higher highs and higher lows. That is our textbook definition of an uptrend, but as we all know these trends do end, and resolve in a couple of ways - a basing pattern or a new downtrend established.
Notice the end of the trend happened at the beginning of March, and after a dip the stock went sideways, basing at a high level. That is the more positive approach following a long uptrend.
To view the chart in a new window, click here.
The moving average convergence divergence (MACD) has flattened out and is trying to move higher. This indicator is on a buy signal. Notice at the bottom the Chaikin money flow (CMF), is very strong and pushing higher ahead of the stock.
With the stock trading for about two months in the yellow box it won't be long before Costco is making a run to our price target $800.
We like adding shares of Costco, in TheStreet Pro portfolio and rate it a Two, or stockpile on pullbacks.
At the time of publication, TheStreet Pro Portfolio was long COST.
