Chart of the Day: Costco Heads Higher From a Solid Bottom
This may be the time to add shares.
You've reached your free article limit
You've read 0 of 1 free Pro articles.
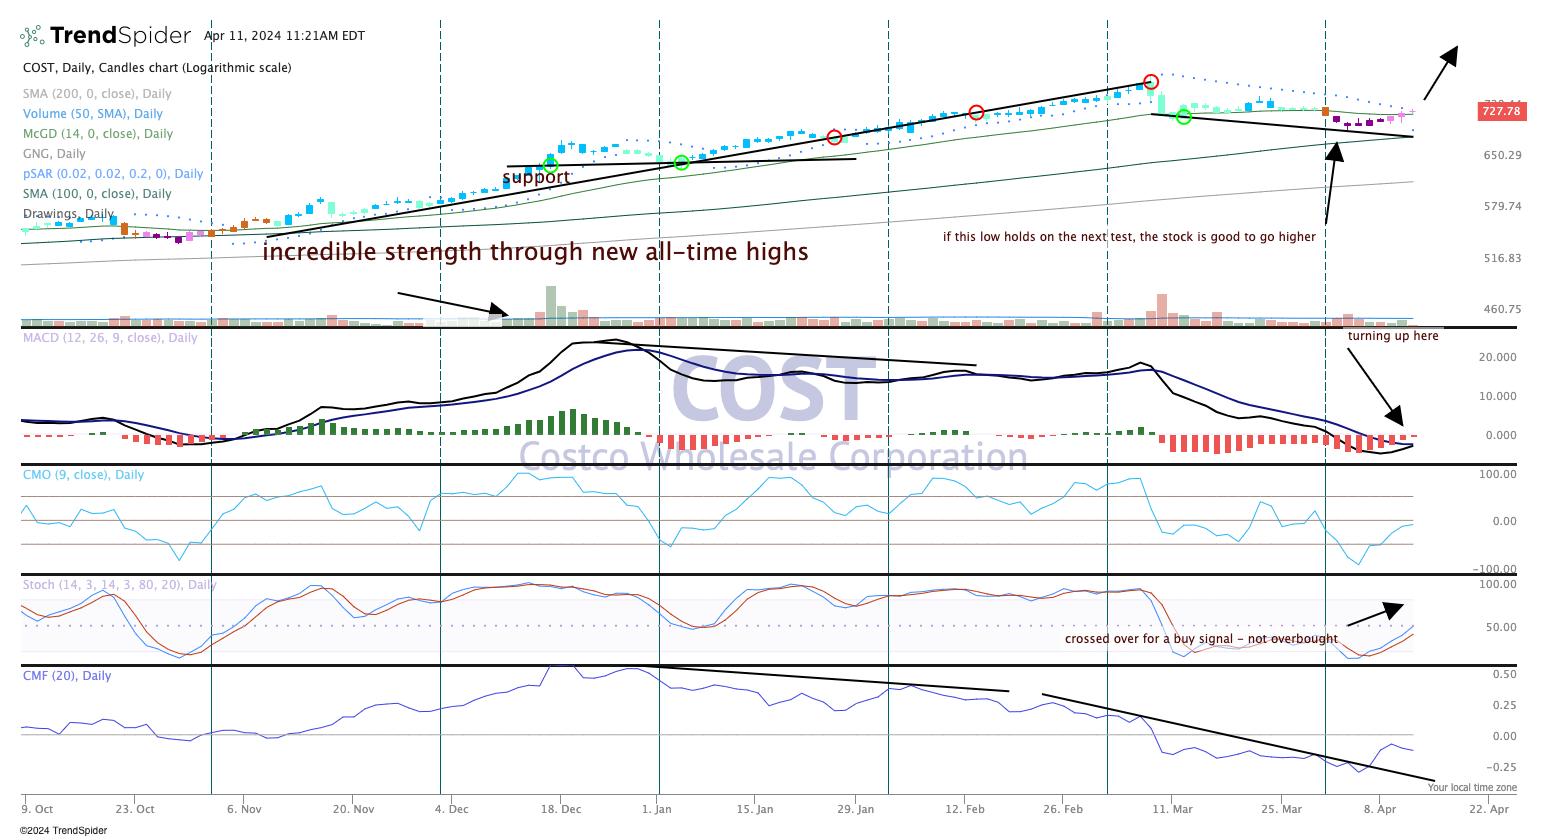
One of the biggest names in TheStreet Pro Portfolio is Costco COST. The big warehouse store was on a monster run from late October but ran into some heavy selling after reaching some extreme bullish readings.
A corrective period is not unusual, and more likely a basing period is useful to digest a strong upside move. We see that happening now with Costco, but more importantly we can see where the recent low level touched (call it $697) is going to be solid support.
We would like to see a series of higher lows now, so a pullback from current levels should not break this low.
To view the chart in a new window, click here.
With the strength in the price action, the indicators are also following along. Notice the MACD (moving average convergence divergence) -- which identifies changes in trajectory before they happen -- is turning up and is about to cross for a bullish signal.
We already have a buy signal on the stochastic (arrow in pane 4), while money flow is improved but is still negative.
Over the years, a pullback in Costco was a major buying opportunity. After the recent 12% drop, this may be another chance to add shares. We rate COST a two which means 'stockpile on pullbacks'.
At the time of publication, TheStreet Pro Portfolio was long COST.
