Chart of the Day: Ciena Is Just ‘Hanging Out’
The stock had a vicious correction but seems to have found some balance.
You've reached your free article limit
You've read 0 of 1 free Pro articles.
We are all too familiar with Ciena (CIEN), as it is a member of the current EPS All-Stars basket, and a holdover from the last quarter.
Just looking at the chart, we can see the massive run this stock has had since the beginning of 2026. The subsequent correction that began at the start of June took Ciena to the 100-day moving average where it sits today.
Is that enough of a correction or will Ciena fall to challenge the 200 day moving average (light blue line)? It’s hard to say, but after this recent pullback and steady price action there is a good chance this stock just moves sideways before making its next move, which we believe is higher.
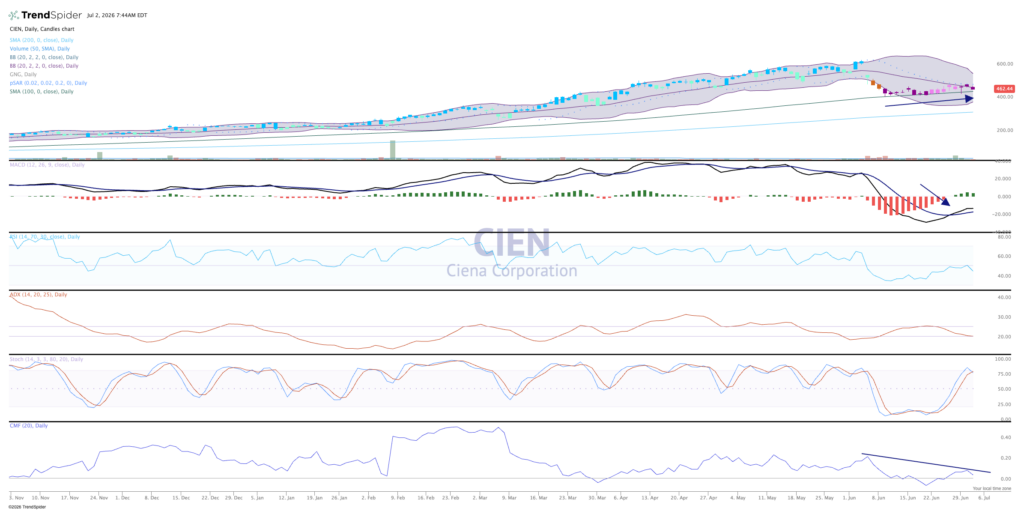
Money flow remains bullish, while MACD has now crossed for a bullish signal, but we do see purple candles, which is bearish on the GoNoGo composite of indicators. Further, the parabolic SAR (stop and reverse) is also bearish (dots above the price), and relative strength (pane 3) has just turned lower.
We’ll give this one some time; they don’t report earnings until early September so we may see Ciena draft (ride the coattails) of other tech names if the group can start moving higher.
As a member of the EPS All-Stars, Ciena does not have a rating.
More Pro Portfolio:
- It’s Time to Lock in Big Gains on This Holding
- 30 Signals Across the Portfolio’s 10 Themes and Strategies
- Weekly Roundup: What We’re Watching as Markets Get Jiggy
At the time of publication, TheStreet Pro Portfolio was long CIEN.
