Chart of the Day: Applied Materials Looks Shaky Before Earnings
As AMAT is set to report this week, a cautious approach is warranted.
You've reached your free article limit
You've read 0 of 1 free Pro articles.
The last time we looked at Applied Materials AMAT, the stock was getting blistered following some poor guidance from competitors. The worry, of course, is that where we see smoke, there is fire, and when ASM Lithography and Lam Research LRCX delivered poor earnings the assumption was that Applied was going to do the same. Hence, the stock has taken a major hit, down some 10% since that fateful day in October (arrow in the top pane on the chart below).
Since then, the stock market has moved on to make new highs, while Applied is struggling to regain lost ground. The struggles for the stock chart are notable, with indicators dragging their feet through the mud.
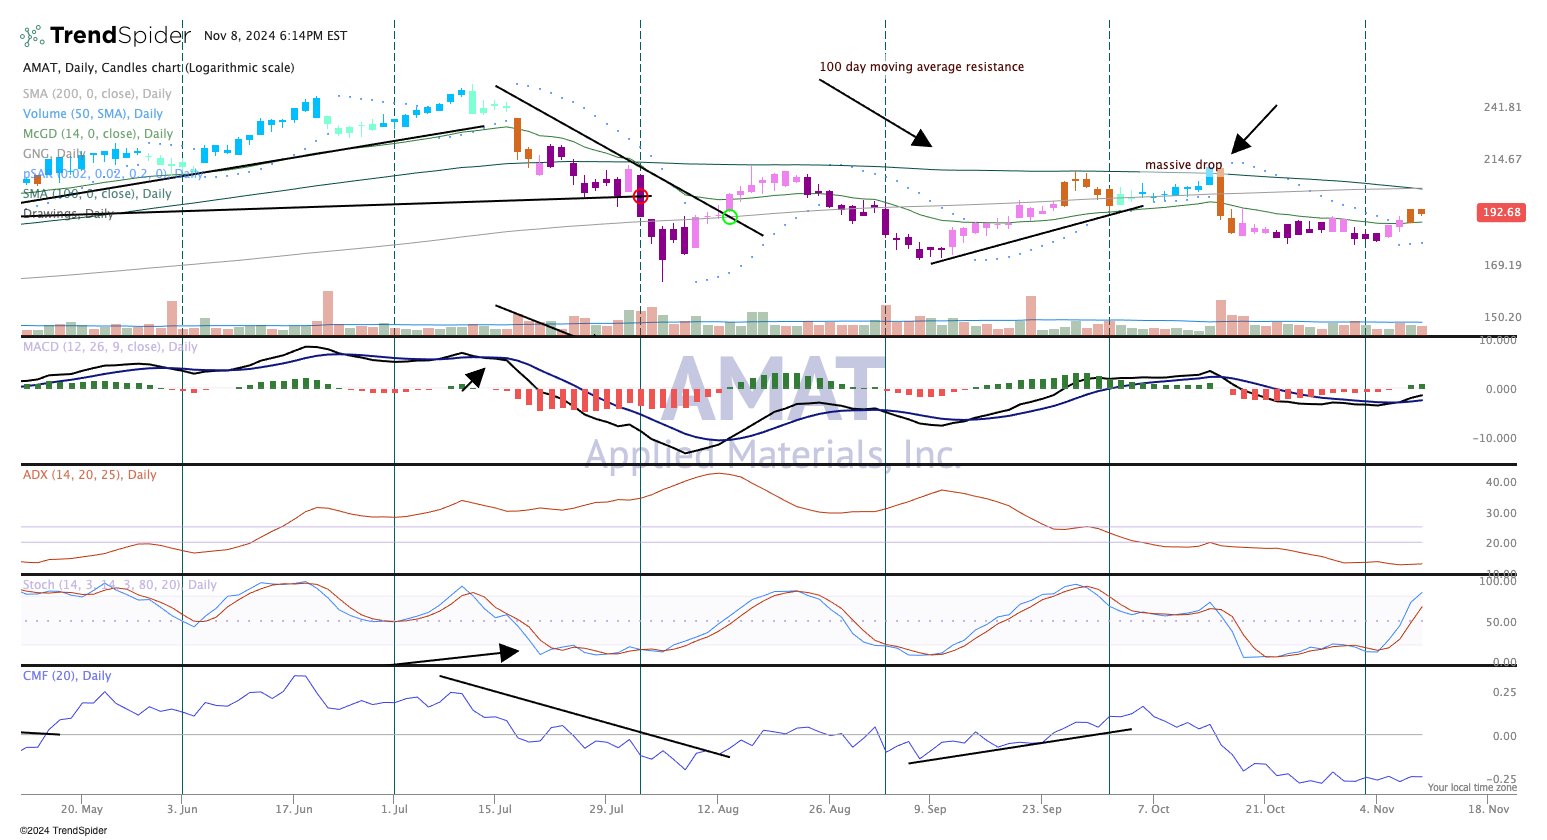
As it is, we only have a tepid buy signal on the Moving Average Convergence Divergence, in the second pane. And the parabolic stop and reverse, or SAR, only turned bullish this past week. But the candles are not bullish, hence we could be faced with a turn down when the company reports earnings after the close on Nov. 14.
As of now, we suggest caution and to refrain from buying shares until the earnings are out and more smoke has cleared. We rate Applied Materials a "Two" in TheStreet Pro Portfolio.
The Pro Portfolio is long AMAT.
