Chart of the Day: Amex Moves From Support to Near Resistance
The big credit card company is looking to advance toward old highs rather soon.
You've reached your free article limit
You've read 0 of 1 free Pro articles.
For American Express (AXP), a 17% move in a month is quite substantial. That is what AXP did from the recent lows in early June, when it appeared the stock was ready to break some good support.
Buyers stepped in at the $300 level and piled in, with AXP making up some lost ground and creating a nice uptrend in the process. Higher highs, higher lows is our textbook definition of an uptrend, and exceeding the prior consolidation area in April shows the bulls have an advantage.
MACD remains on a buy signal; money flow, however, is not encouraging having dipped below zero. The average directional movement (ADX, pane 4) is moving higher; it does not tell the direction but the strength of the trend. Looking at the chart with blue candles (bullish) we can make the assumption the trend is bullish and strengthening.
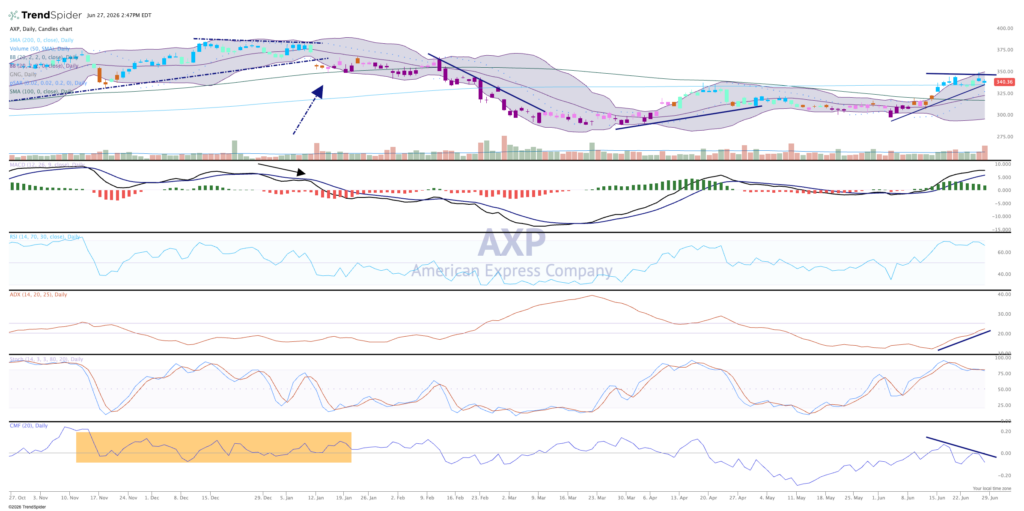
With earnings coming out in a month or so the $350 level seems to be resistance, but with a strong report the buying pressure might be too much to hold this stock back. Old highs come in around 10% higher, the $387 area.
We like American Express in TheStreet Pro Portfolio and rate it a One, or ” buy at anytime.”
More Pro Portfolio:
- Adding to Our Microsoft Position on Weakness
- 30 Signals Across the Portfolio’s 10 Themes and Strategies
- Weekly Roundup: What We’re Watching as Markets Get Jiggy
At the time of publication, TheStreet Pro Portfolio was long AXP.
