Chart of the Day: A Glimmer of Hope for a Frustrating Holding?
This name just can't get going even as the rest of the stock market pushes forward.
You've reached your free article limit
You've read 0 of 1 free Pro articles.
Shares of Alphabet/Google GOOGL have been quite frustrating for us.
The chart below shows GOOGL in a range that just cannot break. The company seems to be being left behind by the rest of the Magnificent Seven cohort. GOOGL is the worst performing stock in the group over the last three months (on a relative basis).
So, what is it going to take to get this big search/ad company moving upwards? Much better price action is the first clue, and recently we have seen a bit of movement upward, albeit slanted within the top/bottom of the range (call it $163-$181). We are watching this range carefully, as a breakout above would certainly be bullish and if volume trends suddenly turned positive we could see a run to $200 in no time.
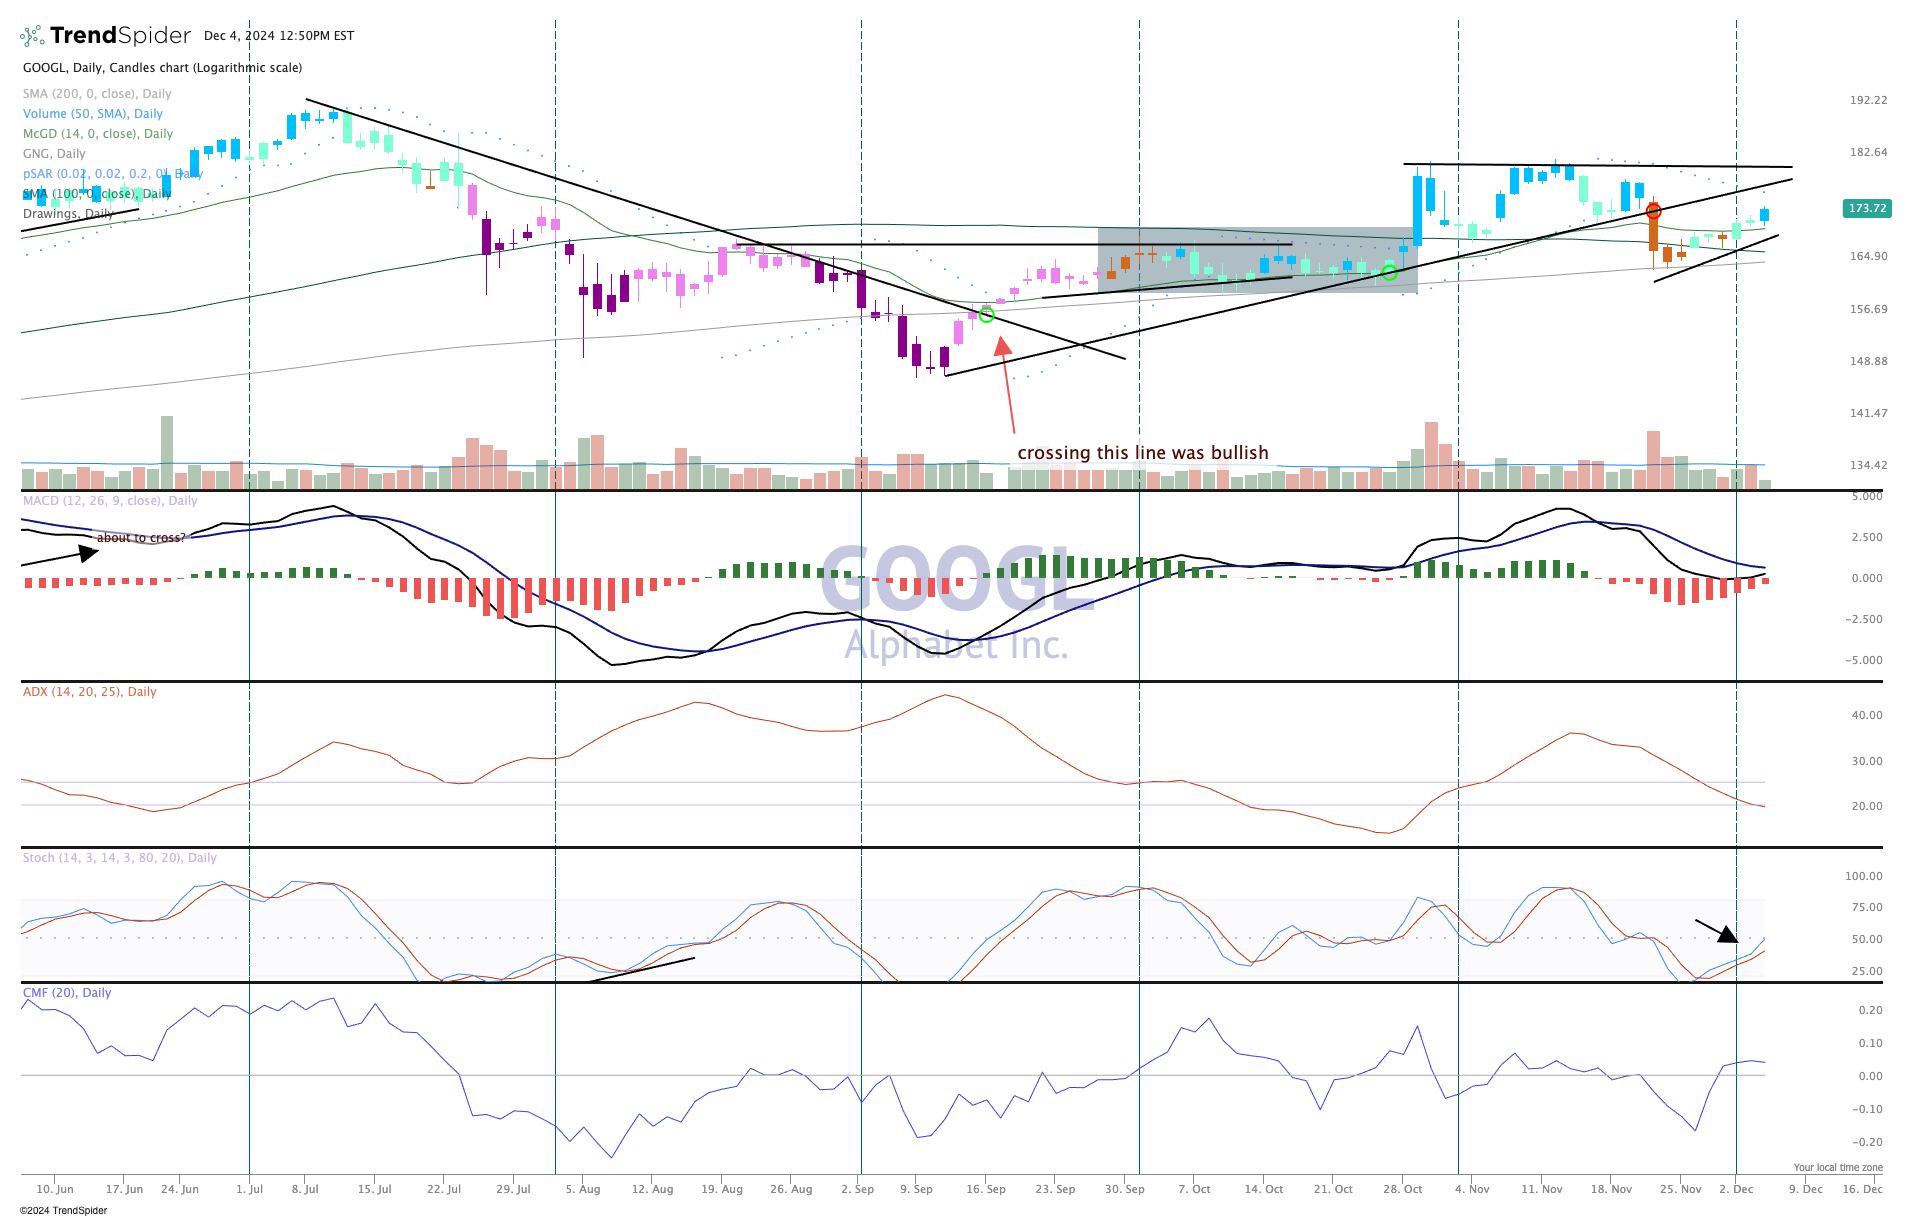
As it is, the indicators are not telling us that move is imminent. Sometimes (not always) a stock needs some sideways action before making its next move. We'll know with Google if that is up if the indicators move to bullish, for which they are not in unison.
We just saw a blue candle develop in the top pane so that's a good start. The parabolic SAR (stop and reverse) is still bearish (dots in the top pane). A glimmer of hope for the bulls to get out of this malaise is the improved stochastics, showing some momentum is building.
We like Alphabet/Google in TheStreet Pro Portfolio and rate it a One.
More Pro Portfolio:
- We're Buying More of This Holding After Elon Musk's Comments
- Weekly Roundup: After a November to Remember, What's in Store for December?
- Headlines for the Holidays: News That Speaks to the Pro Portfolio
At the time of publication, TheStreet pro Portfolio was long GOOGL.
