Chart of the Day: Amazon Muscles Its Way to New Highs
It's not all about online sales for this behemoth.
You've reached your free article limit
You've read 0 of 1 free Pro articles.
As far as brands, is there anything more recognizable than Amazon AMZN? The company has come a long way from just selling books online.
If you remember those days in the mid-1990s you would have had a hard time believing Amazon would reach its current valuation of $2 trillion, let alone being one of the top-five most valuable companies in the world.
Over time, Amazon has reinvented and re-shaped itself to get ahead of the competition, and that affords the company a high market multiple (price vs. earnings). It has moved up steadily, and over the past 11 years (since the FANG acronym was born) Amazon is up more than 1,500%, well more than the S&P 500, Nasdaq or any other index.
So, where is it going today?
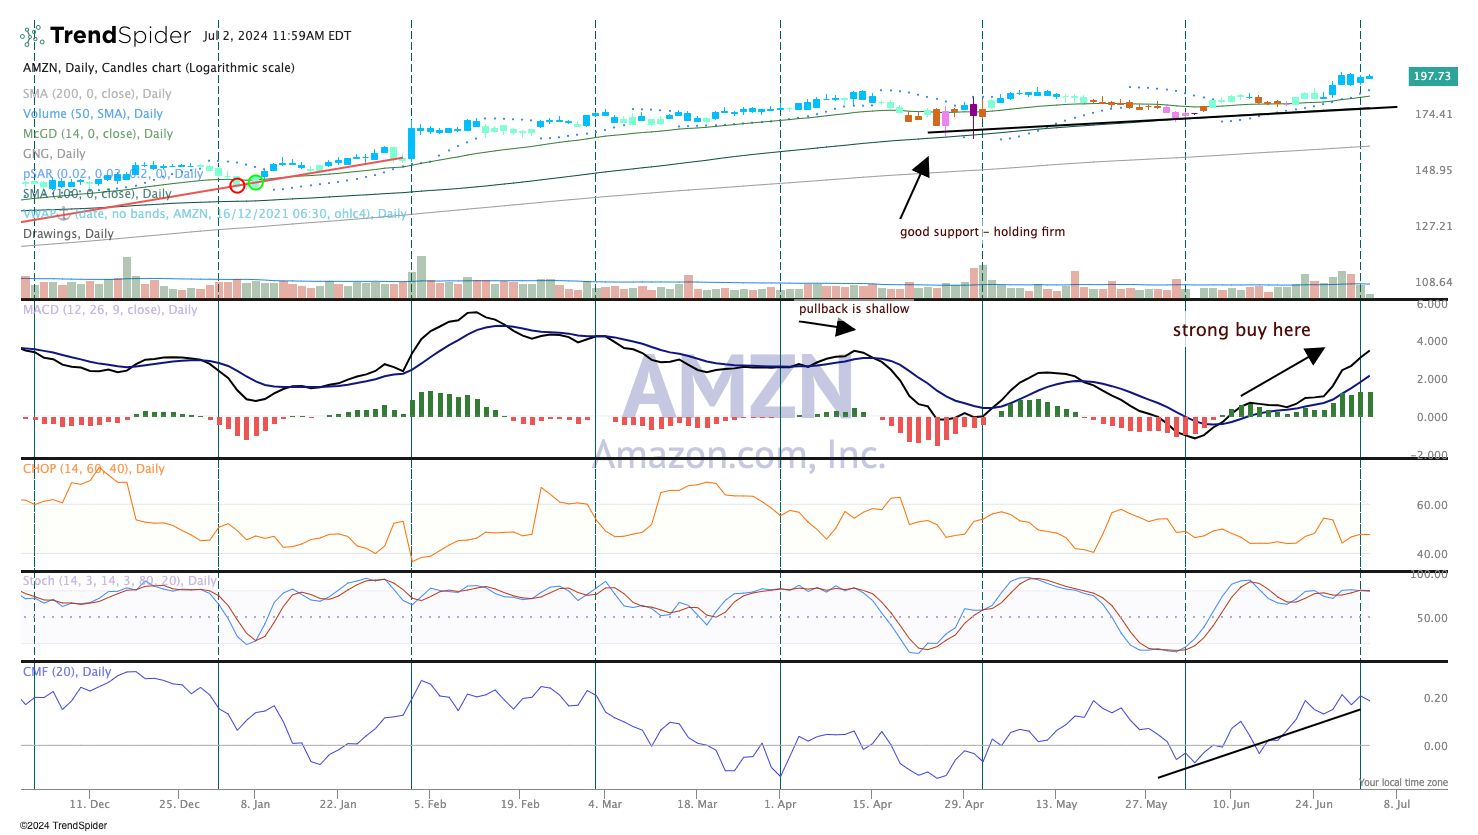
We see a stock that recently reached new highs and now is consolidating those gains. The chart above shows a strong MACD (moving average convergence/divergence) while money flow remains strong (bottom pane).
Candles are blue, which indicate a strong buy on the GoNoGo indicator. With good support in the low $180s range we could see Amazon make a run this summer into the $220s or higher.
We rate Amazon a One in TheStreet Pro portfolio.
More Pro Portfolio:
- Amazon's Spending Plans Prompt Us to Buy More Shares of This Position
- Weekly Roundup: Looking to the Second Half
- How the Latest Signals Are Impacting Our Portfolio Holdings
At the time of publication, TheStreet Pro Portfolio was long AMZN.
