Yellow Flags Waving Across Wall Street
Here's why we're still cautious when looking at the technical picture.
You've reached your free article limit
You've read 0 of 1 free Pro articles.
The major equity indexes closed mostly higher Thursday with positive internals for the New York Stock Exchange and Nasdaq, but we still see yellow flags waving.
The trading session did not result in any shifts in the technical picture with most of the index charts in near-term neutral trends, while cumulative market breadth remains bearish. The McClellan overbought/oversold Oscillators that were suggesting a bounce yesterday morning are now mostly neutral, while investor sentiment is overly bullish and extended forward valuation of the S&P based on Bloomberg’s forward 12-month earnings estimates remains very extended above ballpark fair value. As such, we're increasingly cautious for the markets for the near term.
The Charts and Technicals
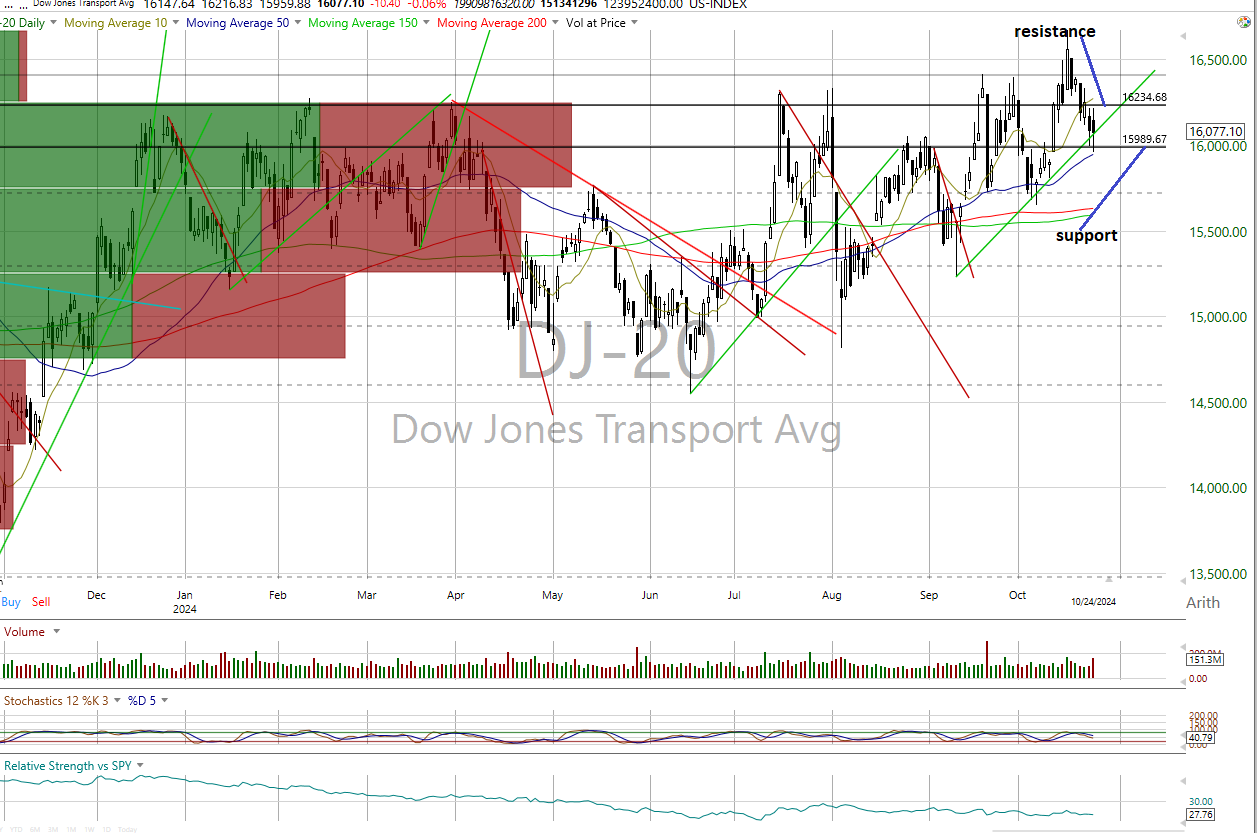
The bounce from Wednesday’s rout saw gains on all but the Dow Jones industrials and Dow Jones Transports that posted losses. Yet, the bounce did not have any impact on the current state of their near-term trends that remain neutral on all but the Russell 2000 that is bearish and Transports staying bullish. Cumulative market breadth is bearish for the All Exchange, NYSE and Nasdaq, suggesting the market’s underlying structure has been weakening. No new stochastic readings of import were generated although all had registered bearish crossover signals lately.
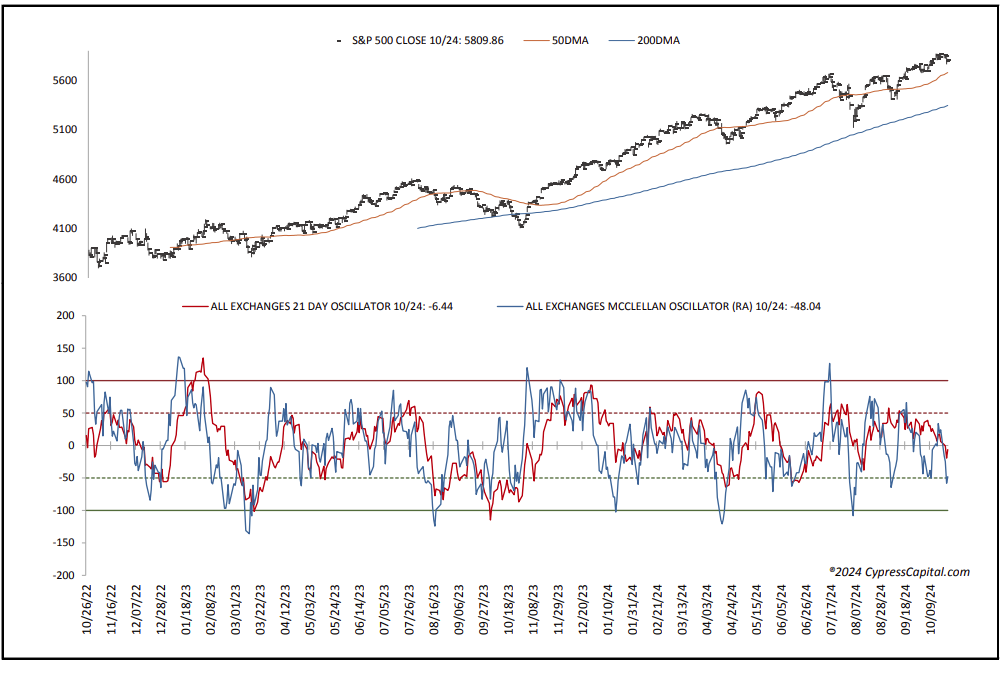
The one-day McClellan overbought/oversold oscillators that were mostly oversold yesterday morning, and suggesting a bounce, are now mostly neutral except for the New York Stock Exchange that is still oversold (All Exchange: -48.04; NYSE: -75.27; Nasdaq: -32.31). The percentage of S&P issues trading above their 50-day moving averages, a contrarian indicator, dipped to 61% staying neutral. The Open Insider Buy/Sell Ratio, meanwhile, rose to 34.2, but stayed neutral as well.
But the detrended Rydex Ratio, a contrarian indicator, rose to 1.09 and is bearish as the leveraged ETF traders have increased their leveraged long exposure after a significant rally. Additionally, this week’s American Association of Individual Investors Bear/Bull Ratio, a contrarian indicator, remains bearish at 0.53 as the crowd is overly bullish. The Investors Intelligence Bear/Bull Ratio, another contrarian indicator, also remains bearish, with bulls overwhelming bears at 21.3/55.7. They suggest an excess of bullish expectations.
Finally, valuation remains a concern. The 12-month consensus earnings estimate for the S&P from Bloomberg rose further to $255.18, leaving its forward price-to-earnings of 22.8 well above the “rule of 20” ballpark fair value at 15.8, as has been the case for the past several months. We believe this premium still presents some risk. Its earnings yield is 4.39%.
The Buck and Treasury
The 10-year Treasury yield slipped to 4.2. Support is 4.10% with resistance at 4.25%. Its near-term trend is bullish. The U.S. dollar, via the Dollar Index Bullish fund UUP, closed lower at $29.18. Its trend is bullish with support at $29.02 and resistance at $29.32.
Bottom Line
It’s time to be more cautious regarding the market’s near-term prospects as the probabilities of a correction have increased.