Worst of the Market Correction Might Be Over
Improvements in the chart trends and cumulative breadth are a welcomed sight for investors.
You've reached your free article limit
You've read 0 of 1 free Pro articles.
All of the major equity indexes closed lower Tuesday with negative NYSE and Nasdaq internals as trading volumes on both exchanges dipped from the previous session.
Most closed near their midpoint of the session that resulted in no technical events of import being generated. As such, all but one of the indexes are in near-term bullish trends while cumulative market breadth remains bullish as well.
On the data front, the McClellan one-day OB/OS oscillators that were overbought and implying Tuesday's weakness are now back to neutral, as is the majority of the rest of the data dashboard. Our one concern remains the extended valuation of the SPX versus ballpark fair value based on Bloomberg’s forward 12-month earnings estimates for the SPX.
The over 600 basis point premium should not be ignored, in our opinion. Thus, while keeping an eye on valuation, we have been selectively buying equities trading at discounts to their forward one-year growth rates while still honoring sell signals on individual names.
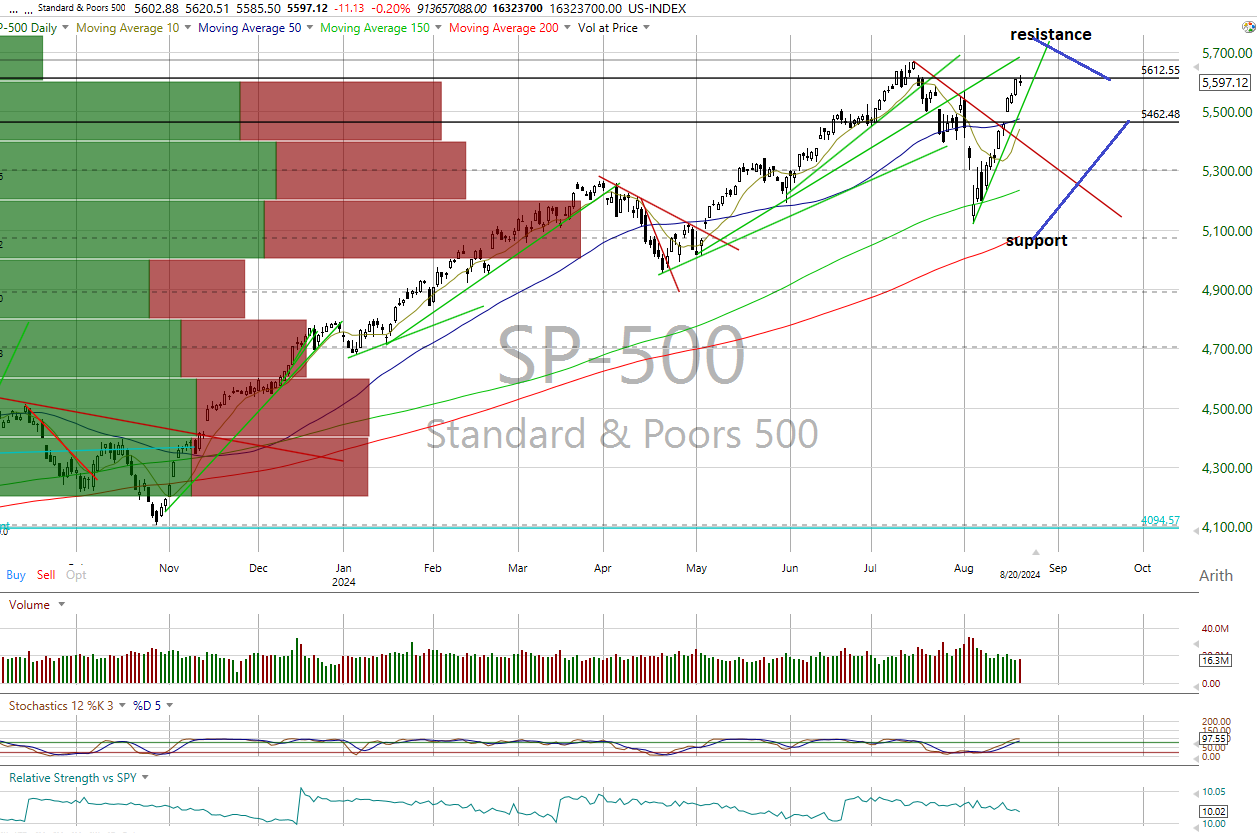
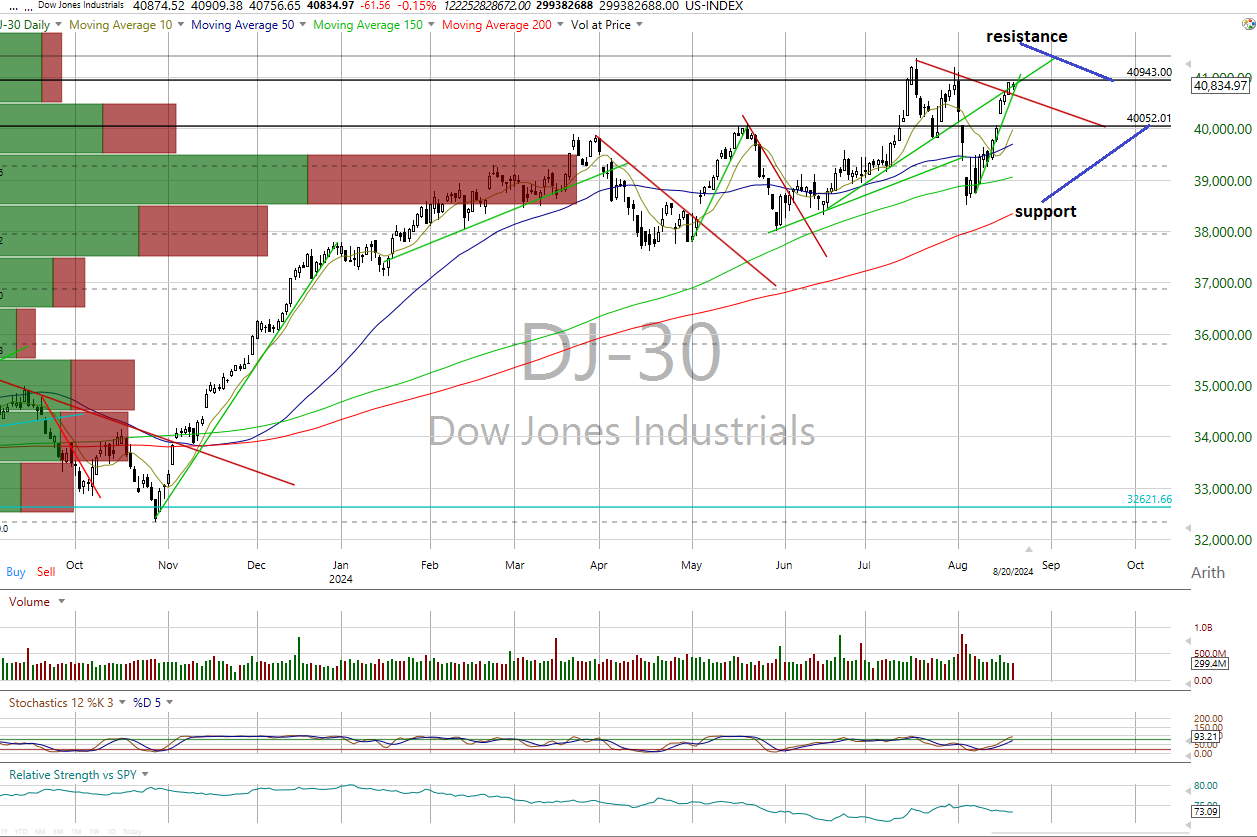
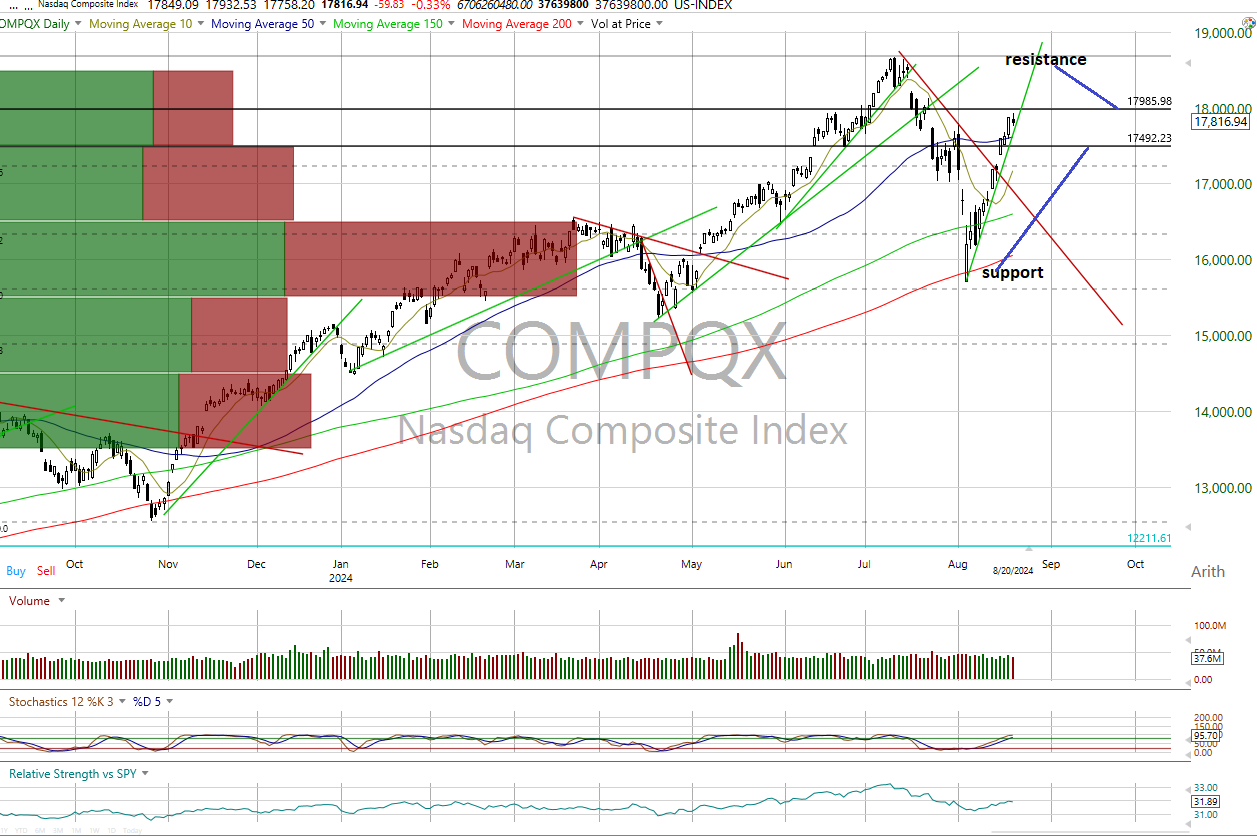
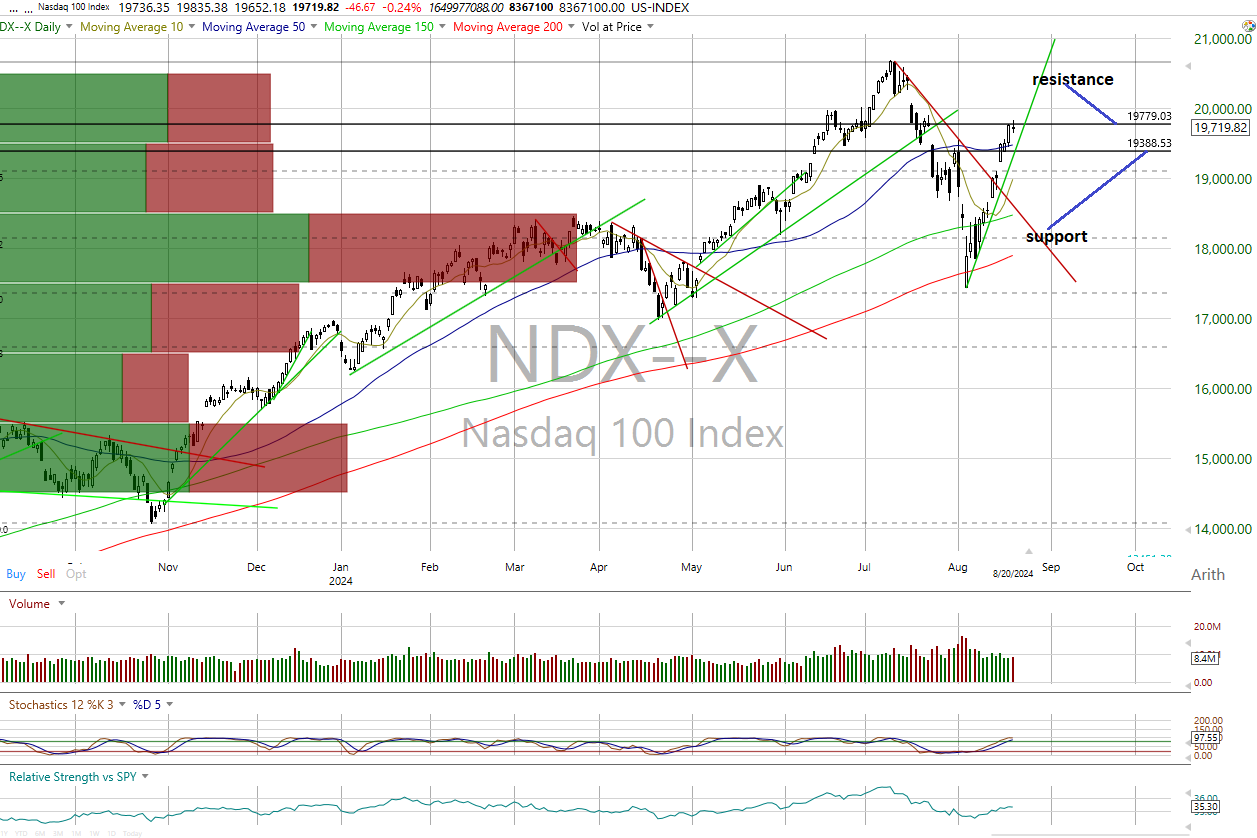
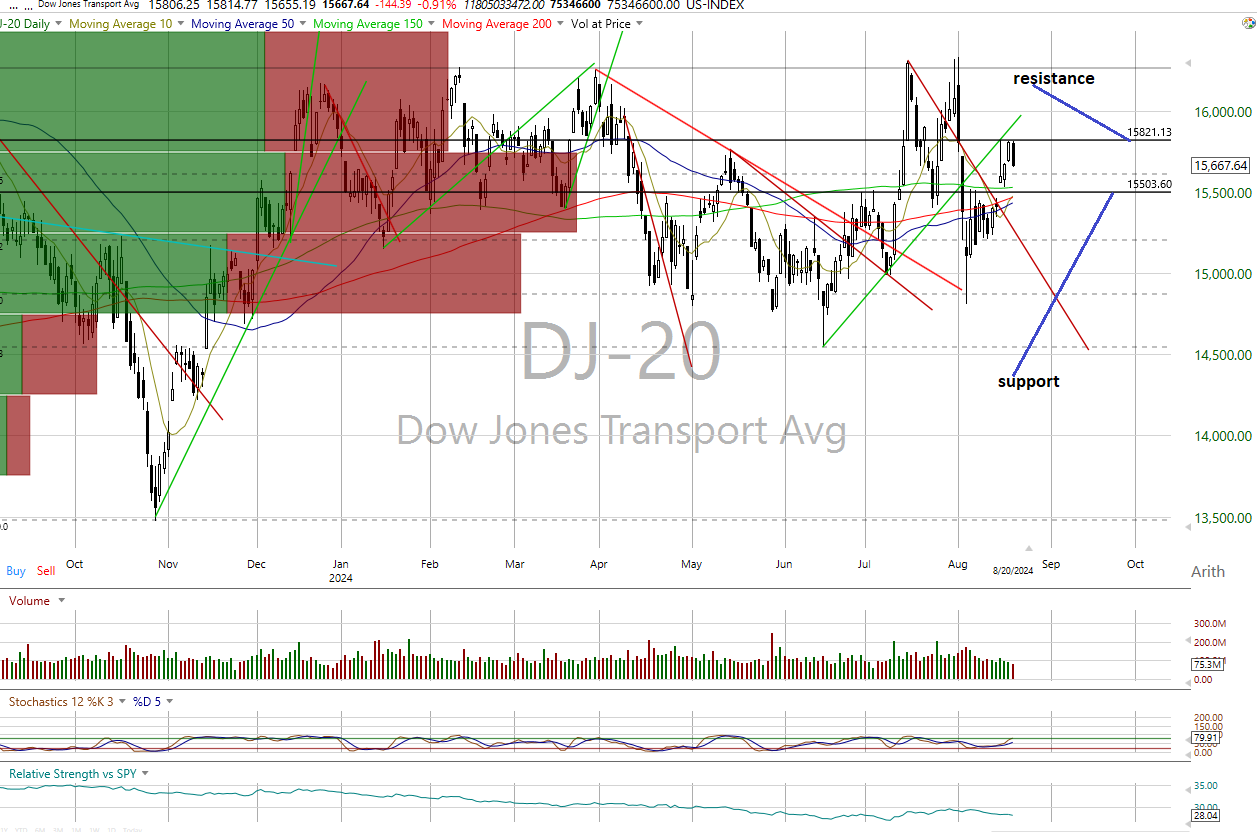
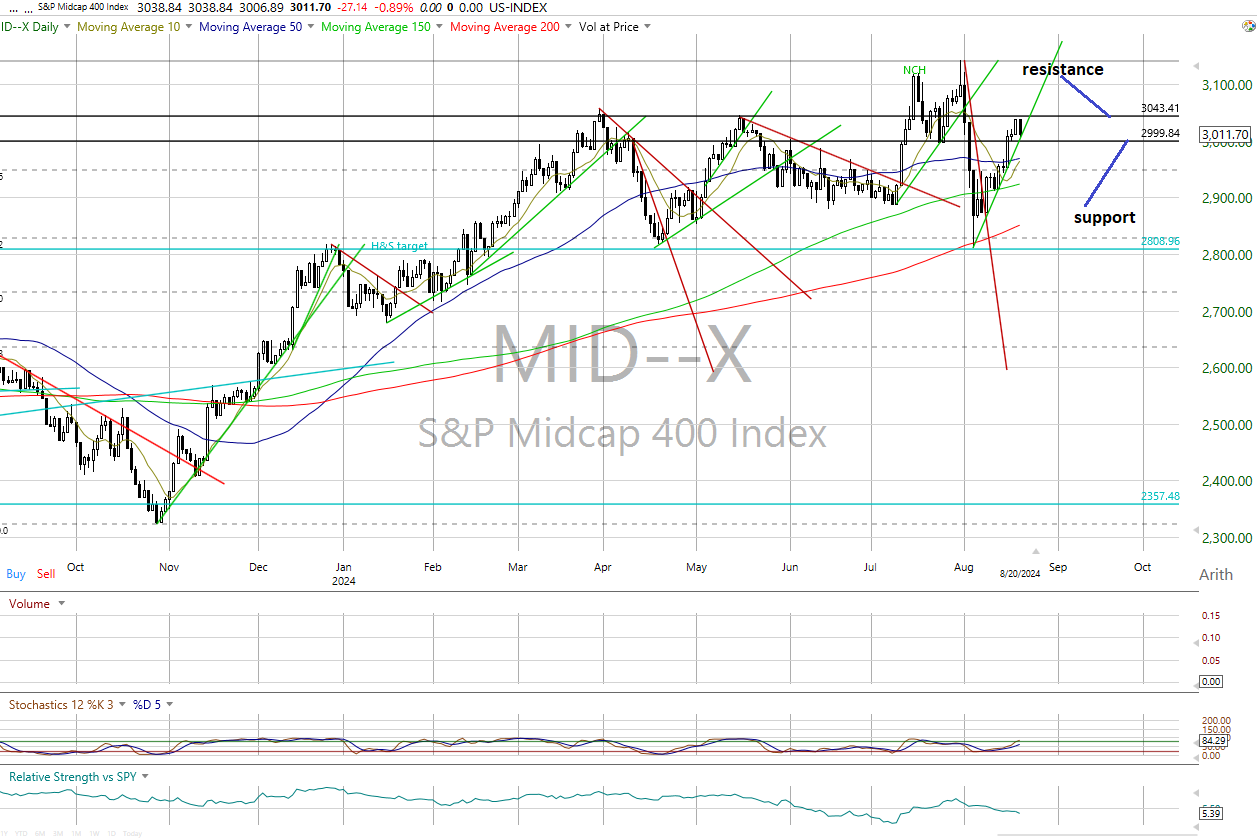
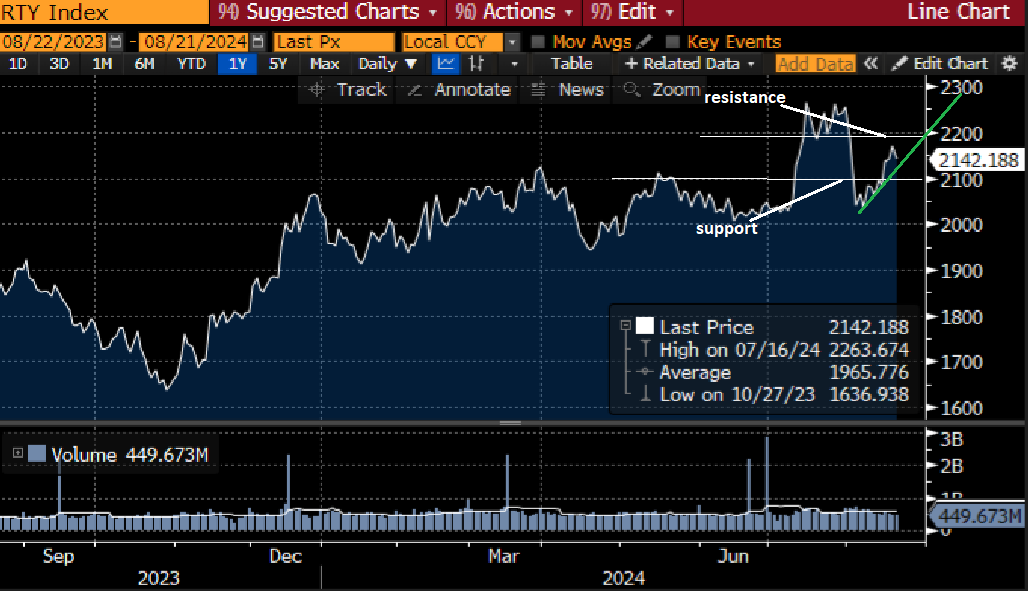
On the charts, all of the major equity indexes closed lower on Tuesday with negative internals on lighter volume. As most closed near the midpoint of their intraday ranges, no technical events of import were registered. That left only the DJT in a neutral trend as the rest remain bullish. Cumulative market breadth for the All Exchange, NYSE and Nasdaq are bullish as well. While all the stochastic readings are overbought, no bearish stochastic crossovers have occurred so far.
The Data Is Largely Neutral
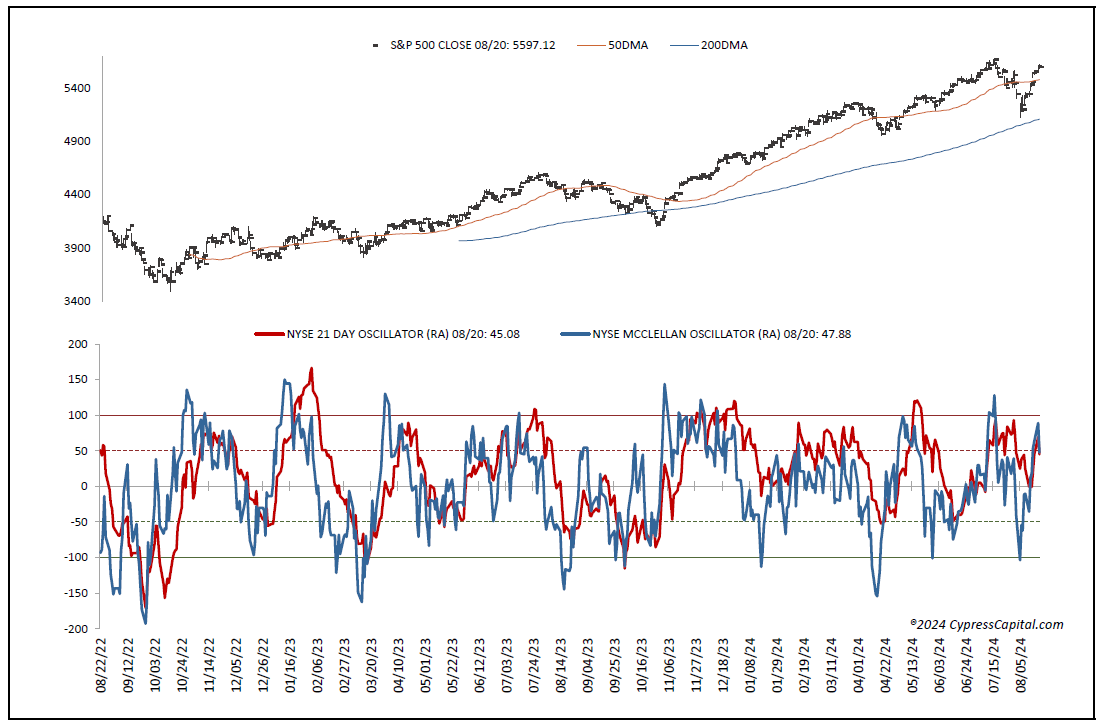
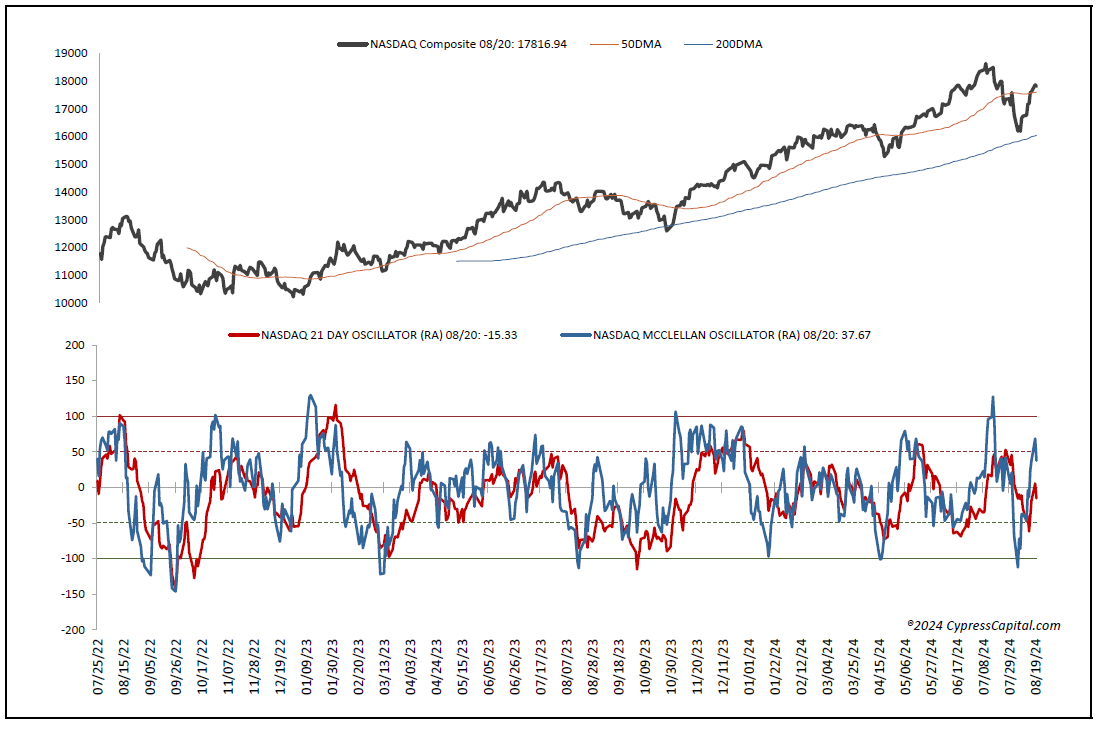
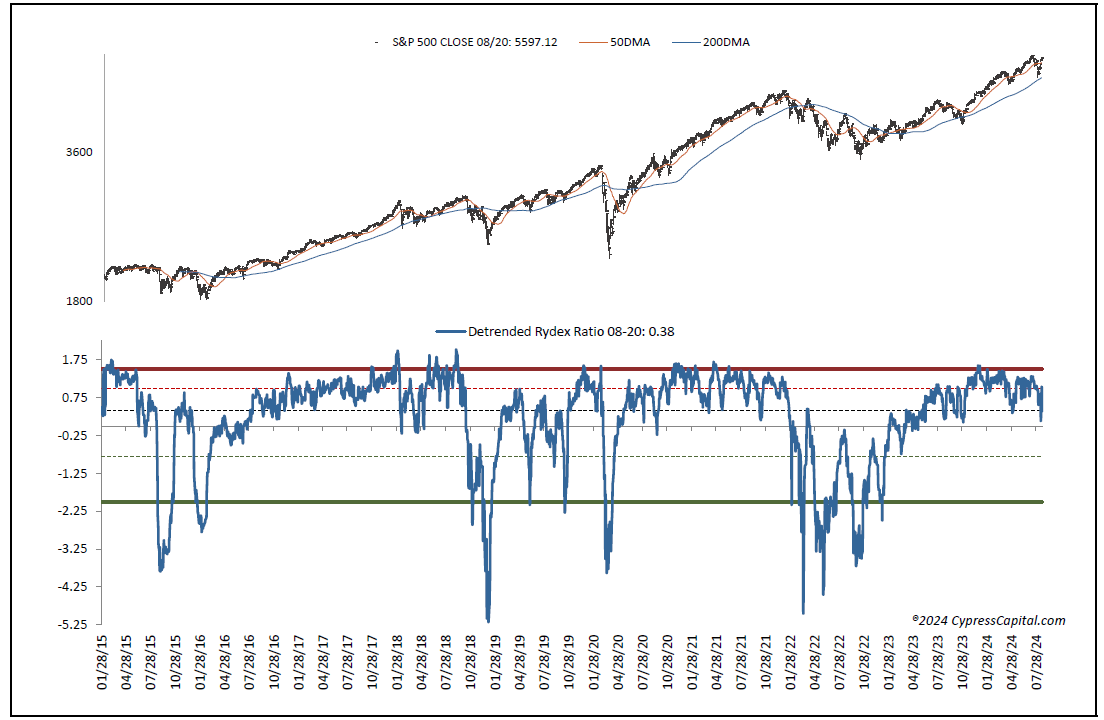
The data is largely neutral. All of the one-day McClellan OB/OS oscillators are back to neutral from overbought (All Exchange: +41.62 NYSE: +47.88 Nasdaq: +37.67). The percentage of SPX issues trading above their 50 DMAs (a contrarian indicator) dropped to 70% but remains neutral. The detrended Rydex ratio (a contrarian indicator) fell to 0.38 from 1.04 and is now back to neutral from bearish.
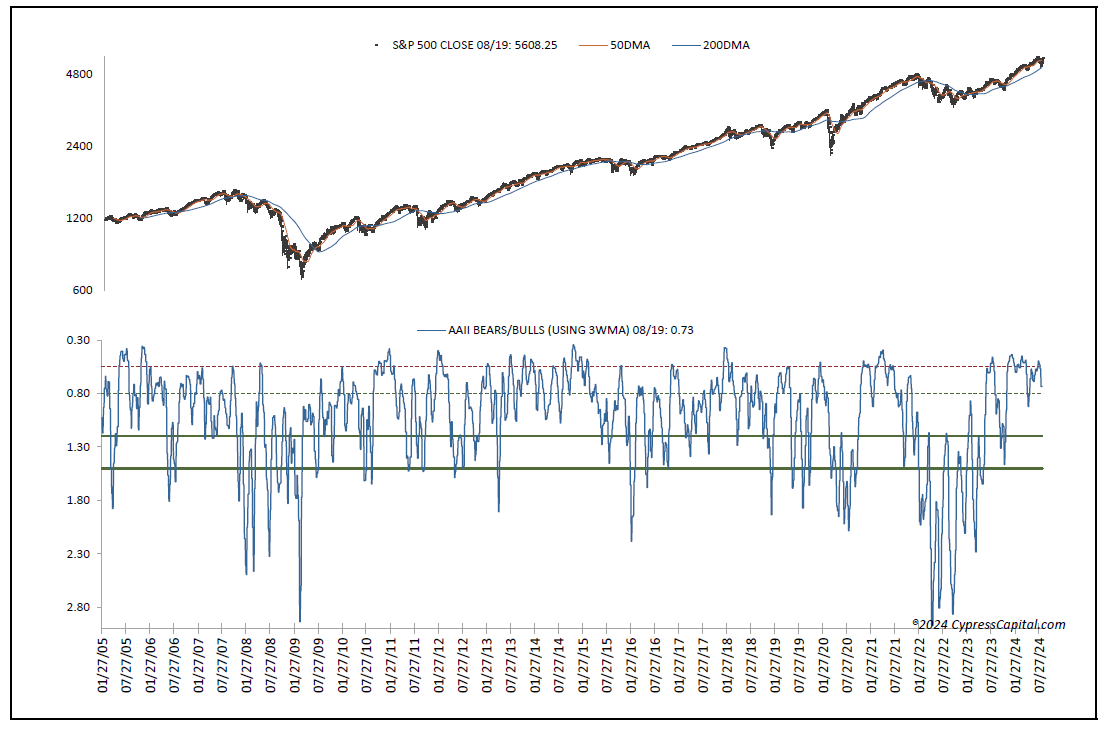
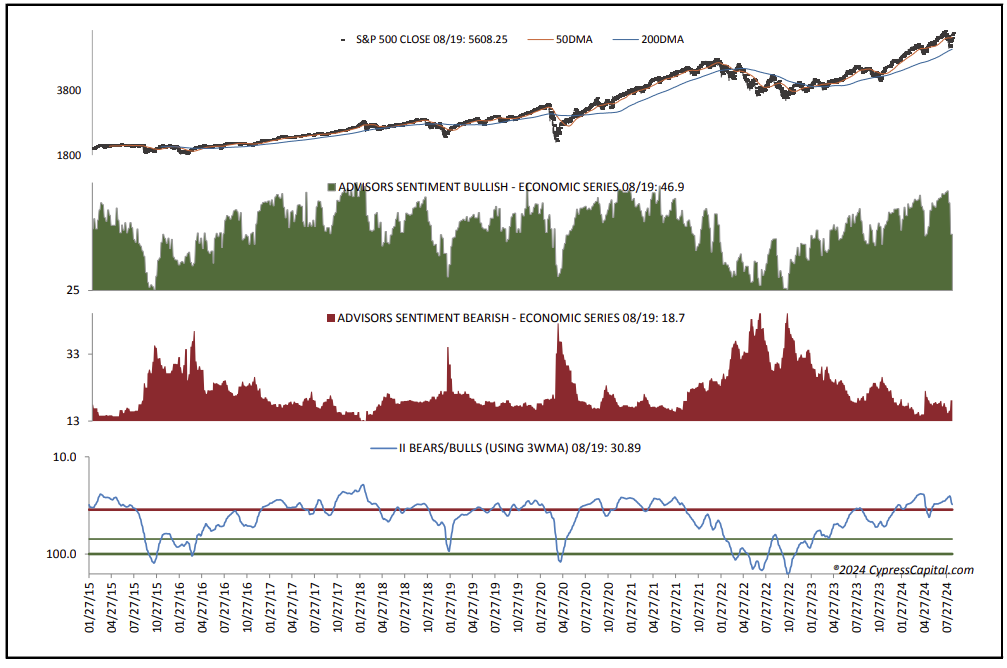
This week’s AAII bear/bull ratio (a contrarian indicator) dropped to 0.73, staying neutral. However, the investors intelligence bear/bull ratio (a contrarian indicator) stayed bearish at 30.89% with investment advisor bulls continuing to outweigh bears by a wide margin.
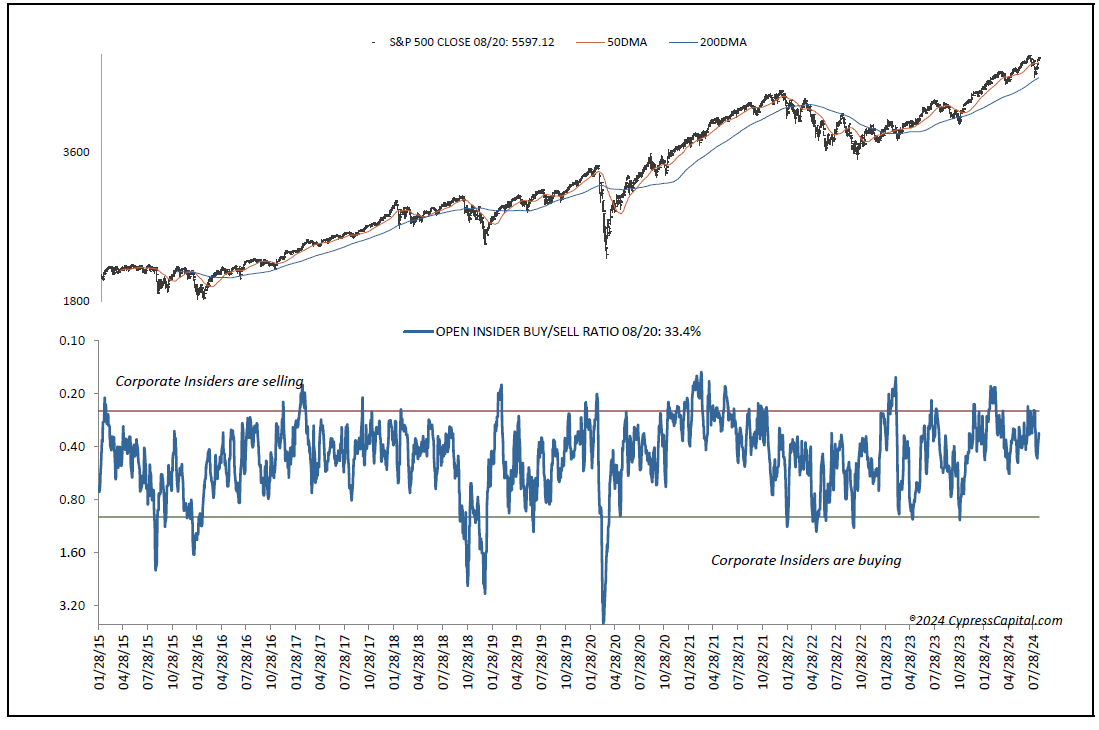
We believe the “wall of worry” could use some further strengthening. The open insider buy/sell ratio dropped to a neutral 33.4% as insiders did some selling.
Valuation Remains a Concern
Finally, valuation remains a concern. The 12-month consensus earnings estimate for the SPX from Bloomberg are unchanged at $250.36. That leaves its forward p/e of 22.4, still well above the “rule of 20" ballpark fair value at 16.2. We believe this premium remains significant and presents some risk. Its earnings yield rose to 4.47%. The 10-year treasury yield slipped to 3.82%. Support is 3.79% and resistance is at 3.97%. Its near-term trend is bearish.
The U.S. dollar, via the UUP ETF, closed lower and below support at $28.16. Its trend is bearish, with new support at $28.07 and resistance at $28.35.
Bottom Line
In conclusion, the improvements in the chart trends and cumulative breadth are a welcomed sight, suggesting the worst of the recent market correction may have been achieved. And while valuation for the SPX remains extended, we have been selective buyers of late while still honoring sell signals on individual names.
- SPX: 5,464/5,613
- DJI: 40,052/40,943
- COMPQX: 17,492/17,9860
- NDX: 19,389/19,779
Reviewing the Charts
DJT: 15,438/15,821, MID: 3,000/3,043, RTY: 2,100/2,195
The all-exchange ratio adjusted one-day, McClellan OB/OS is +41.62 (neutral) and +8.16 (neutral) on the 21-day.
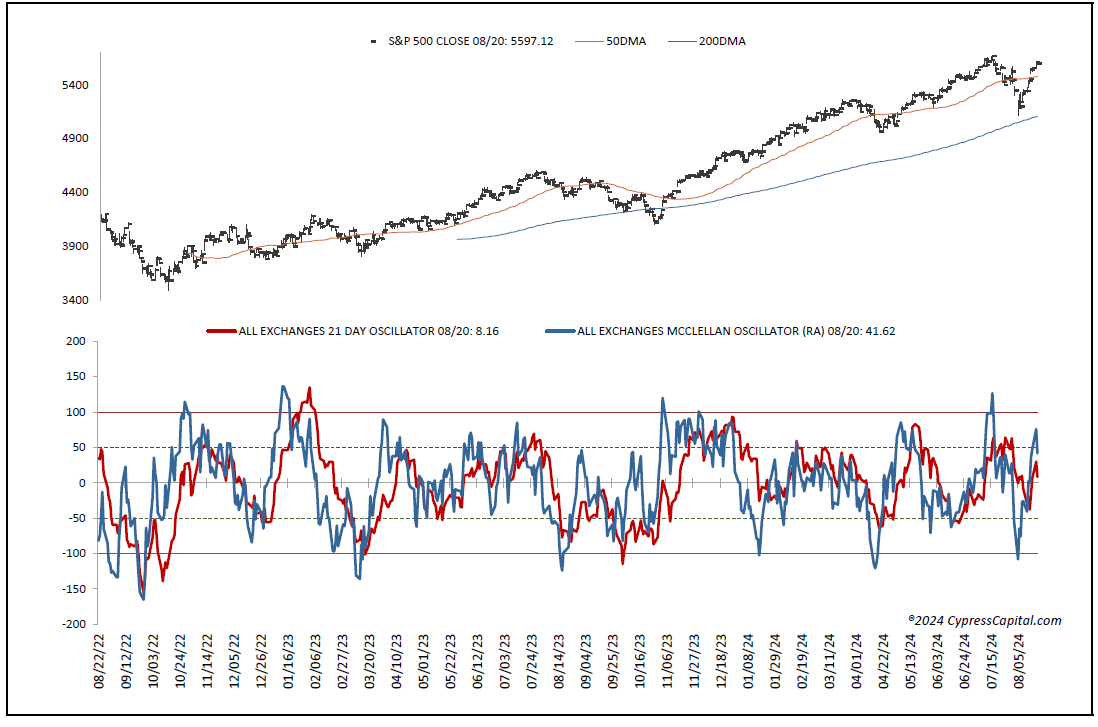
The NYSE ratio adjusted one-day McClellan OB/OS is +47.88 (neutral) and +45.08 (neutral) on the 21-day.
The NASDAQ ratio adjusted one-day McClellan OB/OS Oscillator is +37.67 (neutral) and -15.33 (neutral) on the 21-day.
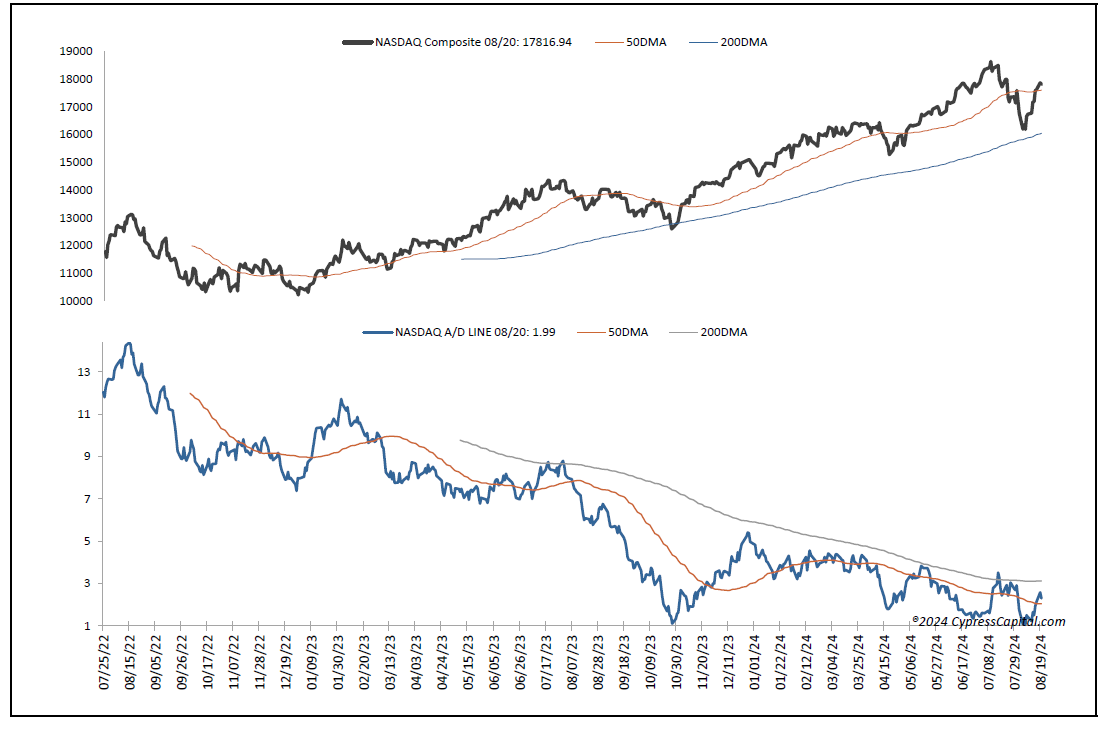
The NASDAQ cumulative advance/decline line is positive and above its 50 DMA.
The detrended Rydex ratio is 0.38 (neutral).
The AAII bear-bull ratio (using 3 WMA) is 0.73 (neutral) as of August 19, 2024.
The investors intelligence bear-bull ratio is 30.89 (bearish) as of August 19, 2024.
The total and equity put/call ratios are 0.72 (bearish) and 0.47 (bearish) on the one-day. The 15 DMAs are 0.98 (neutral) and 0.66 (neutral), respectively. The OEX put/call ratio is one-day is 0.29 (bullish) and 2.64 (neutral) on the 15 DMA.
The percentage of SPX stocks above their 50 DMAs is 70% (neutral).
The open insider buy/sell ratio is 33.4 (neutral).
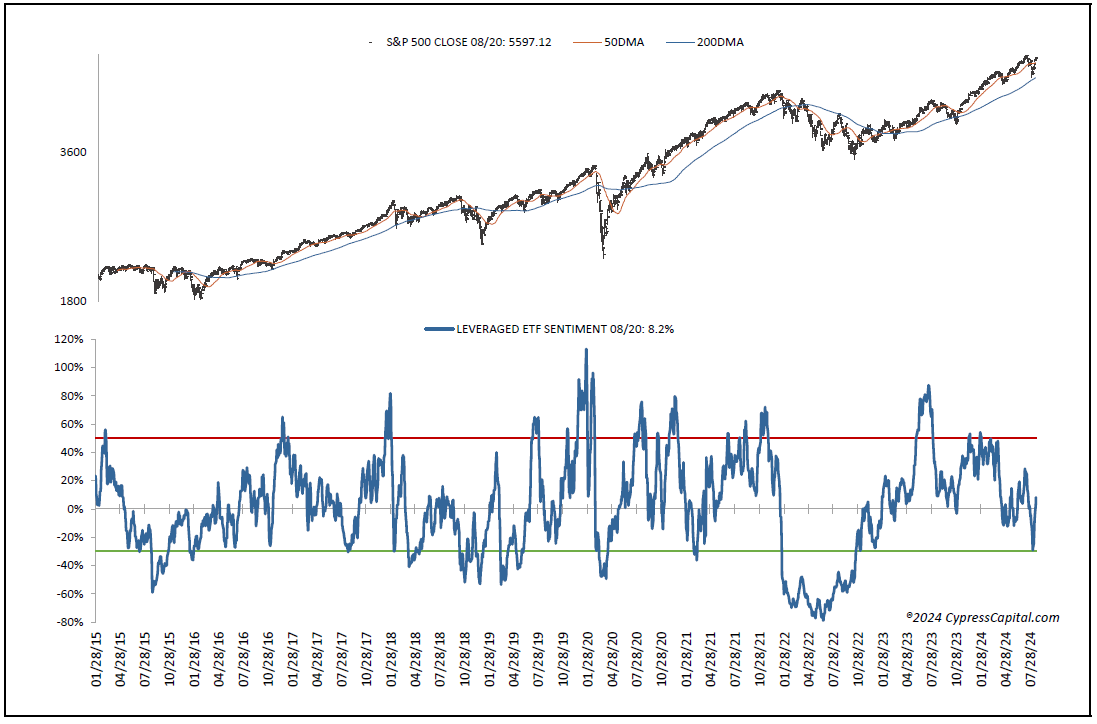
Leveraged ETF sentiment 8.2% (neutral).
Data:
- The all-exchange McClellan OB/OS ratio adjusted is +41.62 (neutral) three-week average +8.16 (neutral)
- The all-exchange A/D line is bullish and closed above its 50 DMA
- NYSE McClellan OB/OS ratio adjusted is +47.88 (neutral) three-week average is +45.08 (neutral)
- The NYSE A/D line closed above its 50 DMA and is short-term bullish
- NASDAQ McClellan OB/OS ratio adjusted is +37.67 (neutral) three-week average is -15.33 (neutral).
- The NASDAQ A/D line is short-term bullish and closed below its 50 DMA
- The percentage SPX stocks above the 50 DMA is 70% (neutral)
- The AAII bear-bull ratio is 0.73 (neutral) as of August 19, 2024
- The investors intelligence bear-bull ratio is 30.89 (bearish) as of August 19, 2024
- Leveraged ETF sentiment 8.2 (neutral)
- The detrended Rydex ratio is 0.38 (neutral)
- The open insider buy/sell ratio is 33.4 (neutral)
- The total and equity put/call ratio one-day readings are 0.72 (bearish) and 0.47 (bearish), respectively. The 15 one-day averages for the total and equity p/c are 0.98 (neutral) and 0.66 (neutral), respectively
- OEX put/call one day is 0.29 (bullish) the 15 DMA 2.64 (neutral)
- The Hang Seng, DAX and FTSE closed above their 50 DMAs
- The Nikkei closed below its 50 DMA
- The U.S. dollar measured by the UUP ETF closed lower at 28.16 and below support. It is short-term bearish. New support is 28.07. Resistance is 28.35.
Commodities in Up Trends:
- Aluminum (closed above its 50 DMA)
- Gold (closed above its 50 DMA)
- Silver (closed above its 50 DMA)
Commodities in Down Trends:
- Hot-rolled coil steel (closed below its 50 DMA)
- Oil (closed below its 50 DMA)
Commodities Trading Sideways:
- Baltic dry bulk rate (closed below its 50 DMA)
- Copper (closed below its 50 DMA)
- CRB spot raw industrials (closed below its 50 DMA)
- Natural gas (closed below its 50 DMA)
- Uranium (closed below its 50 DMA)
Market Internals:
- The major equity indexes closed lower on Tuesday
- Internals were negative on the NYSE and Nasdaq
- Volumes were below the prior session on the NYSE and Nasdaq
- NYSE: A/D: 949/1821 U/D. Volume: 878M/2.1B. Total Volume:3.07B
- NASDAQ: A/D: 1496/2760 U/D Volume:2.51B/2.89B Total Volume:5.41B