What It Means That These Stocks Have Stopped Responding to the Bonds
Here's my view on the market and sentiment as a bunch of groups buck the recent trend and don't join the bonds.
You've reached your free article limit
You've read 0 of 1 free Pro articles.
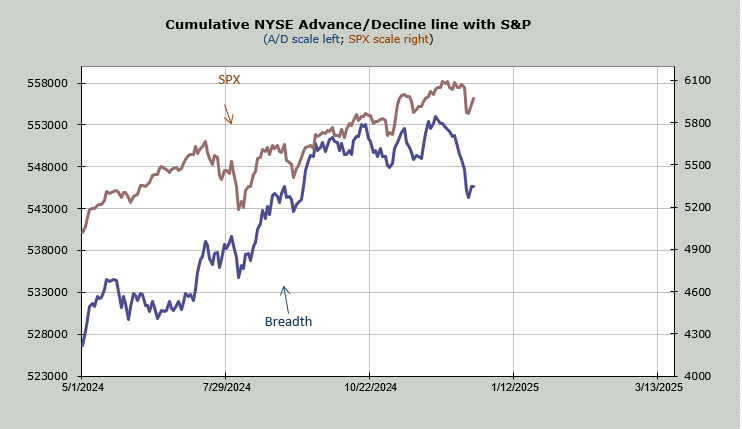
I know you’re thinking it’s been a crummy Santa rally so far, and it has. You can see on the chart below how the S&P 500's rebound looks so different than the rebound in breadth (blue line).
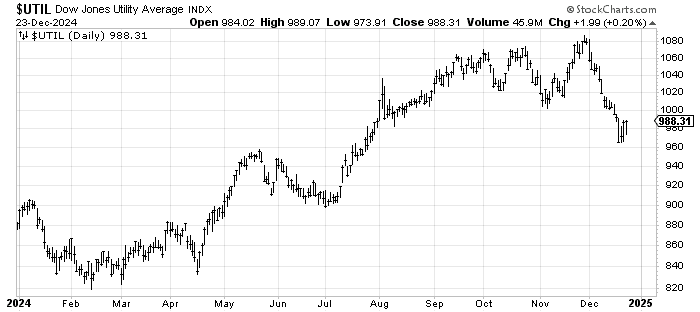
But I would also note that the bonds did not have a great bounce on Friday and fell yet again on Monday (the Daily Sentiment Index is 10; it was 9 on Thursday evening). Yet did you notice the Utes stopped going down; it’s been four days since the Utes made a lower low.
Is the chart great? No, we have discussed the broadening top formation but we have also noted that to complete the formation the Utes ought to rally to 1000-1020, which they are doing. But my point is they have stopped responding to the bonds for now.
They have been the leaders, presaging much of the move in the bonds lately so I note that they stopped going down for now.
IYR, an ETF for the REITs, also didn’t join the bonds on Monday, nor did the Homies. These are all groups that tend to move with the bonds.
The industrials and materials and energy have all been terrible in December. They, too, have stopped going down, despite the bonds and the buck on Monday. I am sure there is some ETF that can tell us value vs. growth but my pencil tells me value stocks have stopped going down for a few days and a lot of the small-cap growth stocks that trade on the Nasdaq felt squishy. Yes that is anecdotal on my part!
Next up let’s talk about the new highs because they continue to lag. The S&P 500 is a mere 100 points off its high and there were 14 stocks making new highs on the NYSE. It’s hard to spin that bullishly but it’s readings such as this that force indicators such as the Hi-Lo Indicator down. This indicator is now at 0.28. Oversold is under 0.15. This reading of 0.28 is the lowest it has been since October 2023.
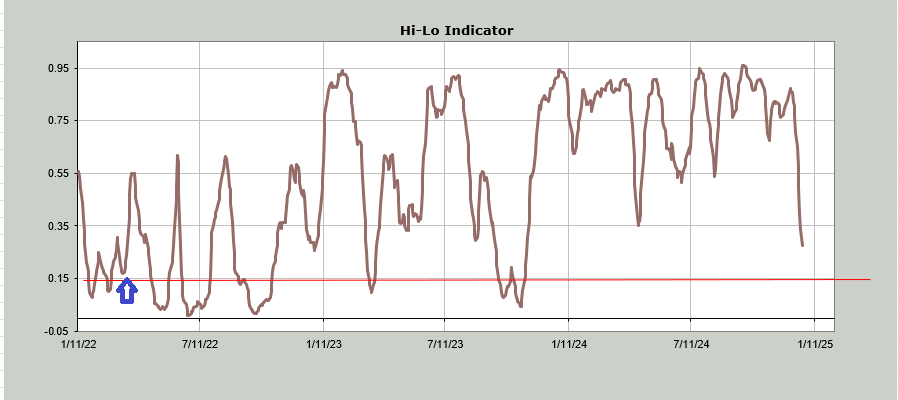
I have placed a blue arrow on the chart because we have to also talk about sentiment. The ISEE Equity call/put ratio jumped to 3.14. This is the highest reading since that crazy reading over 9.0 in March 2022. That arrow on the Hi-Lo chart is to show you where this indicator was at the time.
This indicator was also low but it was not heading toward it but rather turning up from it. In that respect it’s different. But now look at the S&P from that first half of 2022. Once again the blue arrow shows us where we were when we got that wild reading in the ISEE. We were already rallying off a low (similar) but look: we got about another week or two out of the rally before we headed down close to 20%.
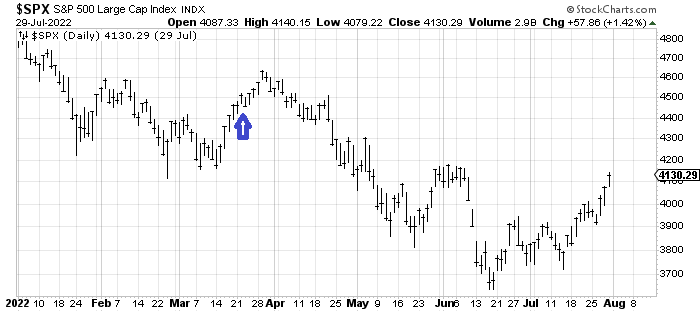
It doesn’t have to be the same now but my point is that oversold readings are great but when they are accompanied by too bullish sentiment, we usually rally and come back down. That remains my view.
Wishing everyone a Merry Christmas and Happy Hanukkah!