We're Seeing a Bearish Turn With a Possible Bright Spot
The index trends are growling in the short term, but one indicator shows a potential pause to the weakness.
You've reached your free article limit
You've read 0 of 1 free Pro articles.
All the major equity indexes closed lower Thursday with negative New York Stock Exchange and Nasdaq internals, as index trends turn bearish for the near term.
NYSE volumes rose and Nasdaq volumes dipped from the prior session and closed near session lows, resulting in several violations of support. The cumulative advance/decline lines also look bearish now.
But there is a bight spot: the one-day McClellan overbought/oversold Oscillators turned oversold and suggest some pause or bounce from yesterday's dive (All Exchange: -96.6; NYSE: -93.0; Nasdaq: -54.43).
The Charts and Technicals
Much of the data is neutral, while valuation for the S&P remains a concern as it's extended above ballpark fair value, as has been the case for several months. As such, while we may see a short-term bounce, there is not enough of a shift in the weight of the evidence to warrant a change in our current cautious outlook for equities, in general, over the near term.
The major equity indexes closed lower yesterday with negative internals and near their session lows. The weakness resulted in the S&P, Dow Jones industrial average, Nasdaq, Nasdaq 100 and Russell 2000 closing below support, shifting the S&P, Nasdaq and Russell 2000 trends from neutral to bearish as the Nasdaq 100 turned neutral from bullish. The midcaps remain neutral.
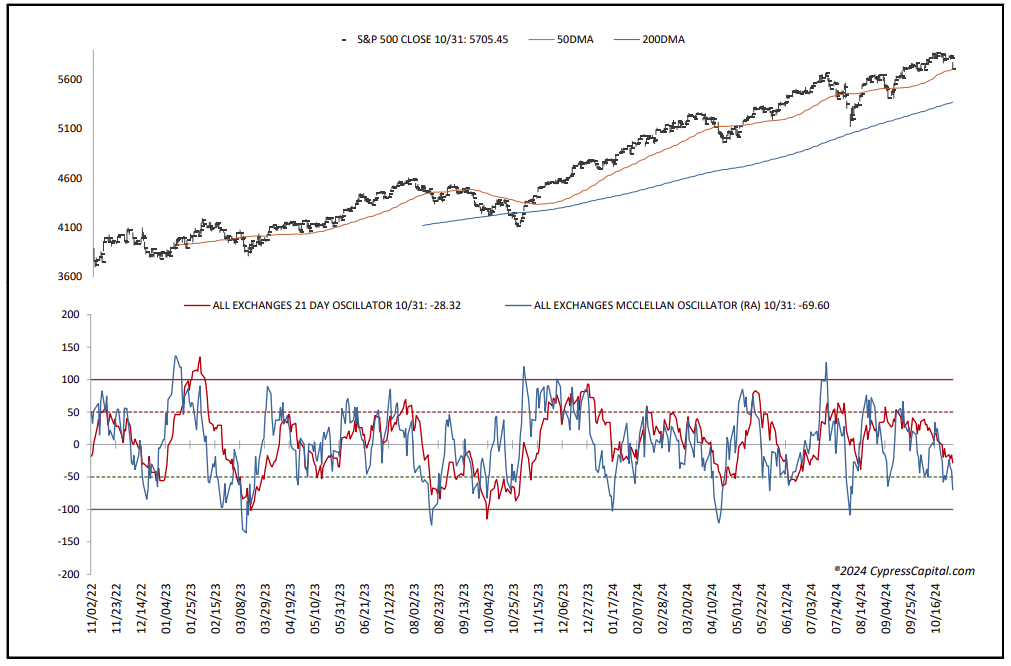
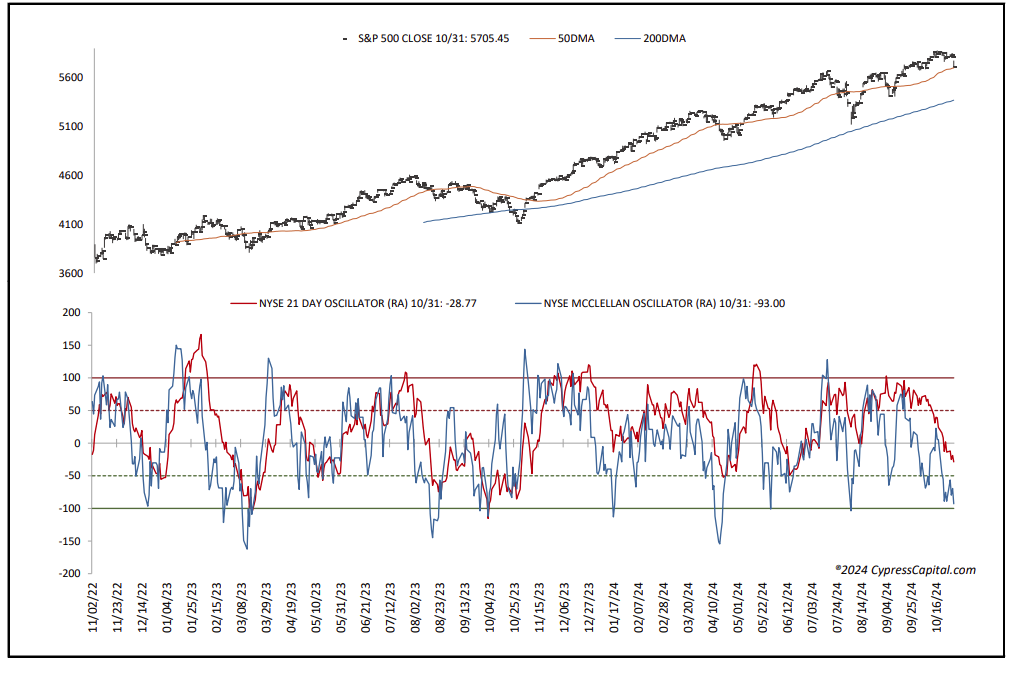
Cumulative market breadth, however, remains bearish for the All Exchange, NYSE and Nasdaq. Its recent deterioration had been importing some forthcoming weakness. Thus, the technical picture is weak. No stochastic signals of import were generated with all but one neutral.
The percentage of S&P issues trading above their 50-day moving averages, which is a contrarian indicator, dropped to 46%, staying neutral. The Open Insider Buy/Sell Ratio was unchanged at 29.1, staying neutral as well. The detrended Rydex Ratio, also a contrarian indicator, rose to 0.98, also staying neutral.
This week’s American Association of Individual Investors Bear/Bull Ratio, a contrarian indicator, turned mildly bearish from bearish at 0.57. The Investors Intelligence Bear/Bull Ratio also shifted to mildly bearish at 21.7/58.0.
Finally, valuation remains a concern. The 12-month consensus earnings estimate for the S&P 500 from Bloomberg rose to $256.88, but its forward price-to-earnings of 22.2 remains well above the “rule of 20” ballpark fair value at 15.7, as has been the case for the past several months. We believe this premium still presents some risk. Its earnings yield is 4.5%.
Treasury and the Buck
The 10-year Treasury yield rose to 4.28. Support is 4.10% with resistance at 4.3%. Its near-term trend is bullish. The U.S. Dollar, via the Dollar Index Bullish fund UUP, closed lower at $29.20 and is neutral. Support is $29.02 and resistance at $29.32.
Bottom Line
Despite the chance of a pause from the weakness or even a bounce, we still believe we should stay cautious.