Watch These Charts Closely as We Head Into Year-End and Early 2024
Why are these so important? Because they are leaders. Plus, a close look at Alibaba, Alphabet and much more.
You've reached your free article limit
You've read 0 of 1 free Pro articles.
The Market
Not much changed in terms of the indicators on Friday, even after that poor breadth day. The main difference is now we can see it on the charts.
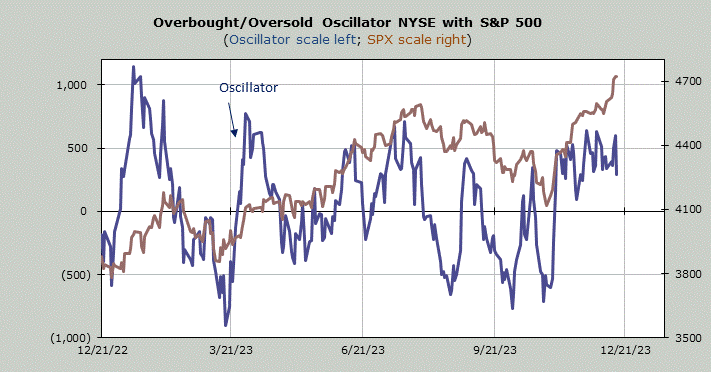
For example, my Overbought/Oversold Oscillator has actually ticked down now.
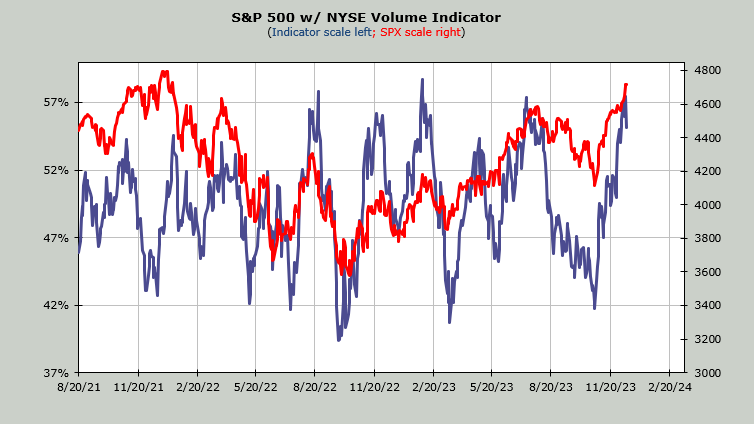
The Volume Indicator ticked down as well.
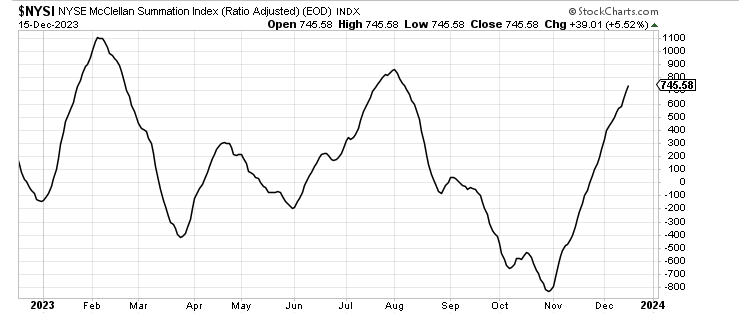
But not the all-important McClellan Summation Index. That continues to rise for now. It would require a net differential of -1,800 advancers minus decliners on the NYSE to halt the rise, and more to roll it over. Friday's net breadth was -1,050 to put that in perspective for you.
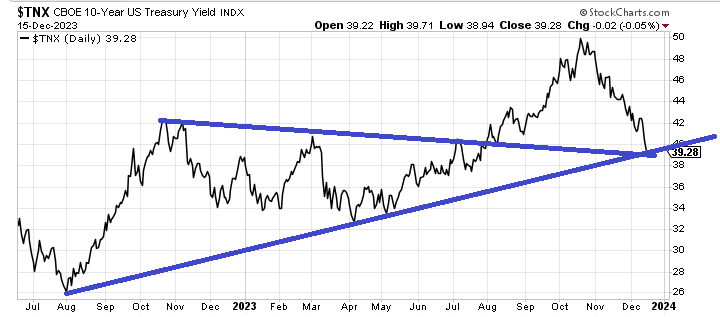
What I would like to show you now are a few charts I think are very worthy of watching closely as we head into year-end and early next year. The three charts are: Gold, The Dollar Index, and Bonds. Oh sure, we always watch those but as I have noted for the last two days, interest rates are at a level that says they ought to go up for a bit (rates up, TLT down). The DSI is at 83 (no change from Thursday) and I'd very much like to see it stay away from 90.
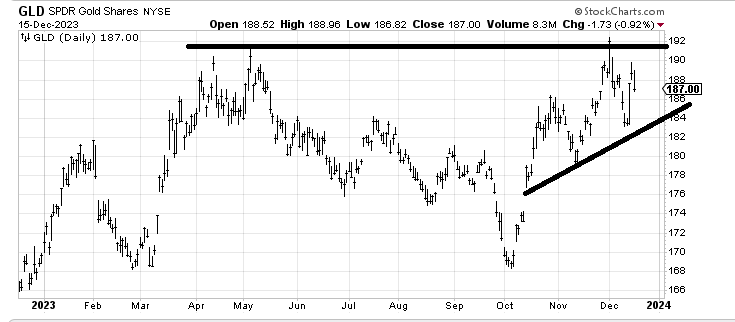
SPDR Gold SharesGLD made another try at $192, the old high again, last week and it only got to $190 before retreating. I know it seems far away but that $184 area is now quite important because if we break that we have a lower high and a lower low.
We had a short discussion about the buck on Thursday evening. I was not as bearish as it seemed everyone had become and the Dollar Index had quite a surge on Friday, regaining what it lost on Thursday. My inclination is that for the time being the dollar does not break 100-101 and that if it gets down there I'd probably like to buy it.
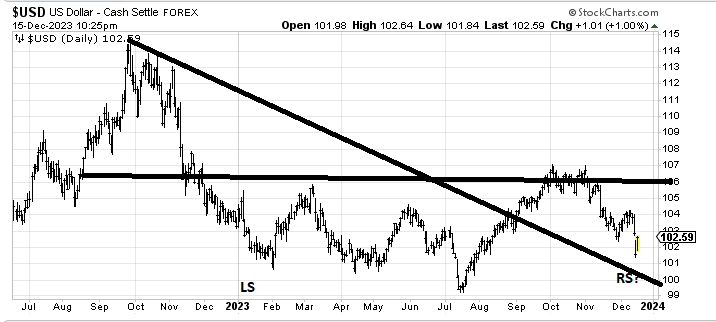
So why are these three charts so important? First, because the DXY rallied and gold fell, which is how it is supposed to work. Yet the bonds held steady. Who is leading whom?
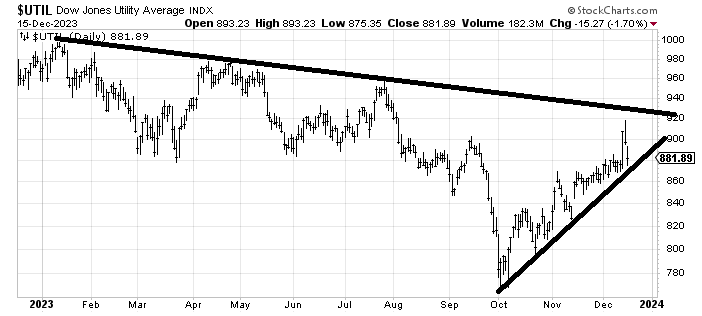
Then there are the Utes. I loved them at the lows and now I think they have run too far into resistance. I will want to buy them again on a pullback, but look at the action in Utilities Select Sector SPDR FundXLU Thursday and Friday. That's quite a reversal. If they break that uptrend line I would have to think the bonds are going to pull back as well (rates rise).
Why is all of this so important?
Look closely at the U.S. dollar chart. It topped one month before stocks bottomed. Look at the Utes. They bottomed one month before stocks did. Gold bottomed in early October while stocks bottomed during the final days. Bonds (interest rates) topped about two weeks before stocks did.
So these are the leaders. And that's why I will watch them so closely in the coming weeks.
New Ideas
In these final weeks of the year I want to address a question about the Chinese stocks that I seem to get often. Can they be winners in 2024?
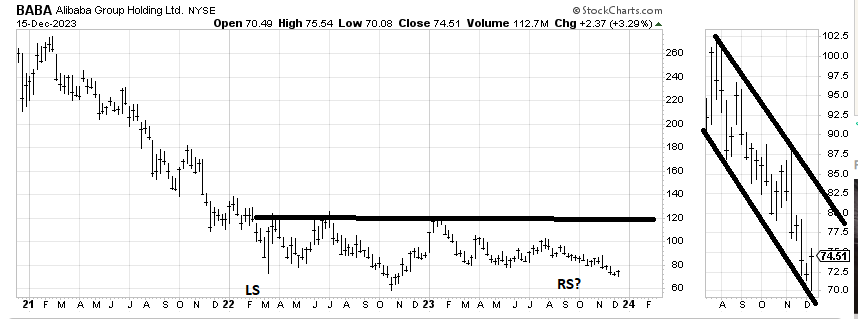
I start with AlibabaBABA because I believe it is one of the most widely known Chinese stocks. I have been asked repeatedly about it and each time I have said it’s a trade (long side) within a downward channel. So let’s take a look at the longer-term (three-year, weekly) chart because it is very possible it is basing.
If this is a base for BABA, it’s possible it is a very funky head-and-shoulders bottom. But let’s start with that action on the right side of this chart, below, the part I blew up that dates back to July. That is the downward channel I have consistently been drawing in on the daily chart (reminder, this is a weekly chart). It does look to me as if it ought to bounce in the next month or so up toward that upper line.
However, unless/until BABA can cross that line we’re still just talking about a bounce within a downtrend. Crossing that line changes the picture for the first time in a year. Is it worth a shot on a risk/reward basis? I think it is. The key will be if, about a month or so from now, it cannot get back up over $80, which is the downtrend line as well as the prior lows from 2023. I do not know where I’d put a stop though.
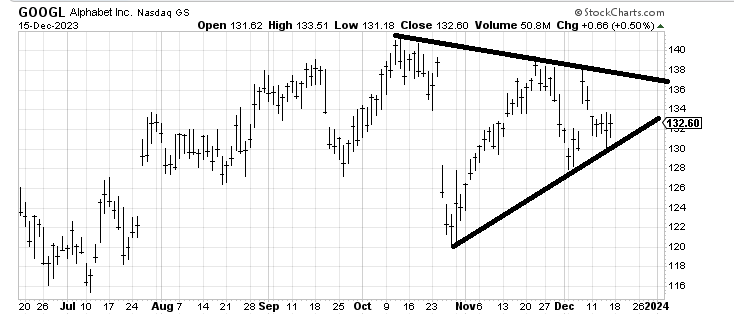
There is someone who has asked about AlphabetGOOGL quite frequently so I’d like to follow up by noting the chart is feeling a bit oversold down here. I’m wrong if it cracks $130 but if I am not wrong GOOGL could rally up to the upper line.
Today’s Indicator
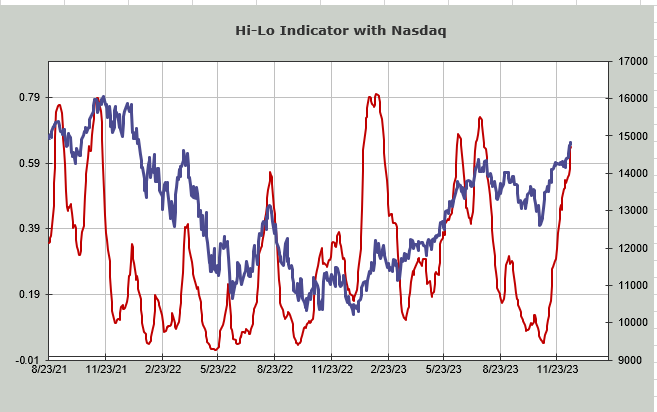
The Hi-Lo Indicator is still rising.
Q&A/Reader’s Feedback
Helene welcomes your questions about Top Stocks and her charting strategy and techniques. Please send an email directly to Helene with your questions. However, please remember that TheStreet.com Top Stocks is not intended to provide personalized investment advice. Email Helene here.
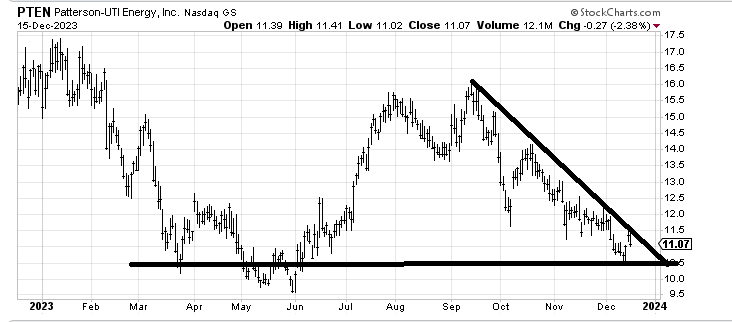
Patterson-UTI EnergyPTEN feels like it is trying to bottom (it is an energy stock after all!) but it has resistance all the way up. I’d like to see it get over $11.50, which would cross that downtrend line and start eating through the resistance. I am wrong if the stock breaks under $10.50 in a significant manner.
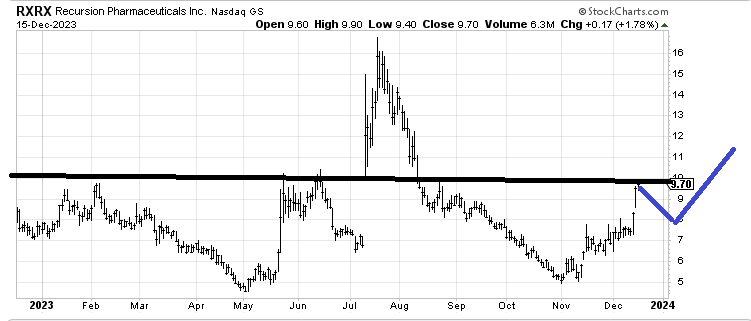
I cannot get excited about buying a stock that has rallied as Recursion PharmaceuticalsRXRX has. But I can if the stock can pull back and develop a pattern akin to what I have drawn in below. Look at what transpired last May/June when RXRX made a similar move and then went sideways for a month, then down then surged. Flag poles tend to need a flag and the recent action needs a flag to me. Or at least it would make for a better chart to me.
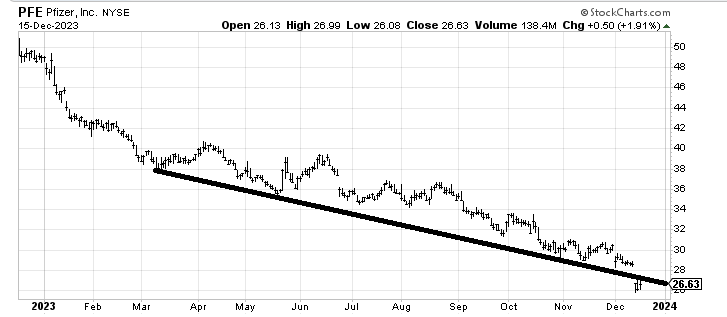
You might recall I tried bottom fishing PfizerPFE at $28.50 when it gapped down on huge volume. That was wrong to do. Can it be right to do it here? Here’s what would make this chart bullish: A gap up over $28. That would leave the last three days as an island. Otherwise I think we’d just be talking about an oversold rally back to $29-ish.
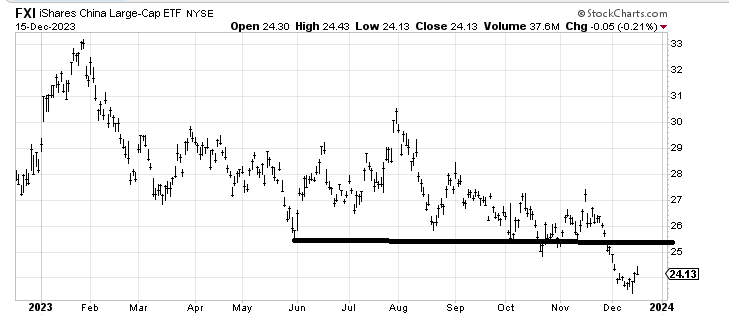
Here’s another Chinese stock question, on iShares China Large-Cap ETFFXI. FXI was working on a base and then it fell out of it. For now I would say the best the ETF can do is a rally back to $25-26. However, if AlibabaBABA can get on track then there’s better chance that this was a false breakdown for FXI. But, for now, I’d start with thinking only $25-26.
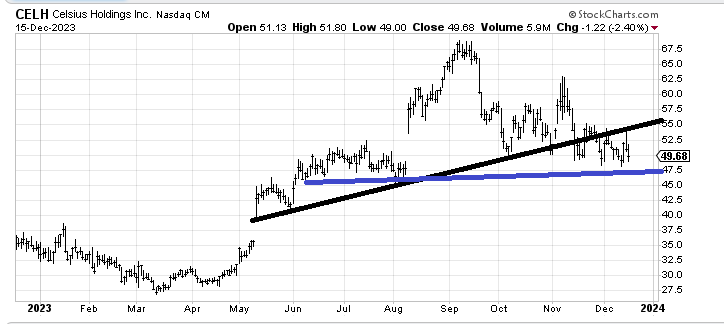
The black line on Celsius HoldingsCELH makes this former hot stock look like its days of outperforming are behind it. The blue line says it can enjoy a short-term oversold rally. Mostly I think it’s going to break that blue line in the coming months.