Walmart Stock Gives Investors Something to Fret Over
Let’s talk about the chart patterns of some key stocks, including Walmart, which is starting to look like Microsoft stock from last November.
You've reached your free article limit
You've read 0 of 1 free Pro articles.

Note: My eye surgery last week was successful, so on Wednesday, I will have the left eye done. I am currently quite lopsided, so if I post any charts that look weird, let’s blame it on the eyes! In any event, I will take the rest of the week off, and with luck, I will be able to see the charts again this weekend with both eyes! The next column will be Monday, June 1st.
We may as well begin with the semis since it’s their world and we’re just trading in it. I want to reiterate what I said a month ago when everyone started calling these charts parabolic. In my estimation, very few are parabolic. At the time, I thought Intel was trending that way.
On Tuesday, we had a major Wall Street firm lift the price target on Micron by about three times what it was. Do I think that is ridiculous? Of course I do. But does the chart look parabolic? Again, I do not think it does.
Let me state this is very subjective; there are no rules here. To me, it looks like INTC (INTC) went vertical, whereas Micron (MU) was a steadier climb. MU did not make a new high until the second half of April, whereas Intel did so the first week. To me, INTC looks like a flagpole, and MU looks more gradual. Again, this is very subjective.
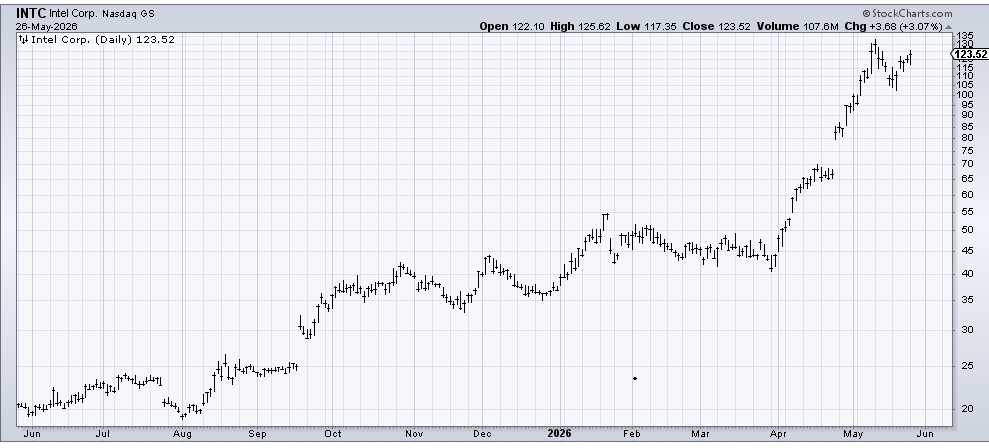
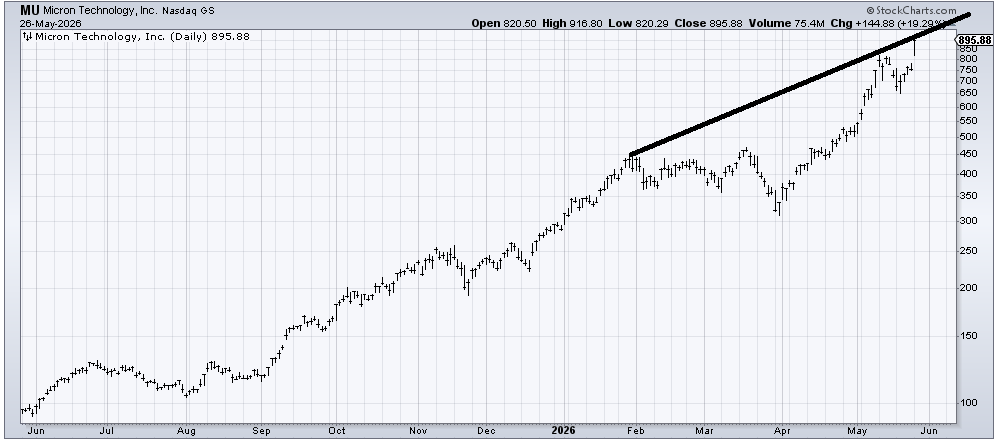
For MU to do something wrong, it would have to go vertical from here (thus creating a flagpole). For it to do something wrong, it would have to back off and rally to a lower high. For it to do something wrong, it would have to open on a gap under 800 and be unable to recapture that gap.
It doesn’t mean I like the chart here; it’s just not my style to chase. And it has some resistance here as well.
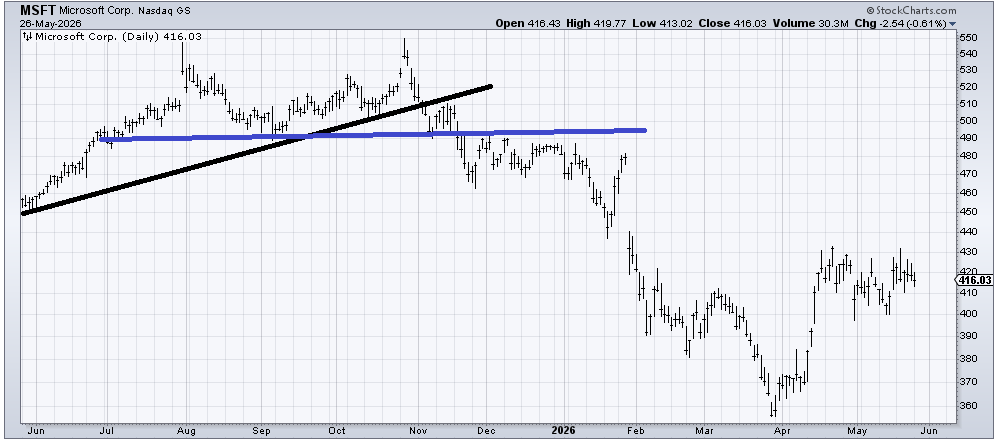
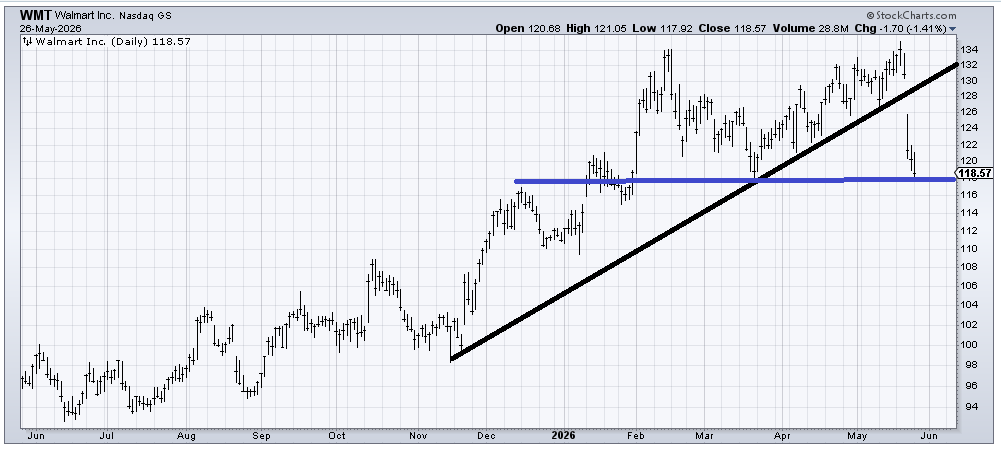
If you want a chart to fret over, then look no further than Walmart (WMT). It is starting to look like a double top, although it is short-term oversold down here. Many months ago, before the collapse in software stocks, I highlighted the chart of Microsoft (MSFT), noting that it looked like a bridge, with two towers. In November, it broke the support (blue line)
Walmart has already broken the uptrend line (black) on a gap, leaving behind the two towers, but it hasn’t broken the roadway (support) yet. If it has a crummy rally in the next few days and then comes back down to break that blue line, I would fret much more over WMT than MU.
But did we get the Daily Sentiment Index (DSI) to giddy on Tuesday with all that Micron and semiconductor chatter? We got it to 80. Two weeks ago, it was at 85 before the push down. Let’s see if we can get to giddy in the next few days.