These 4 Charts Explain Why the Fed Must Cut by 50 Basis Points
Dr. Copper and more show why the FOMC must consider softness in commodities prices as well as weakness in employment.
You've reached your free article limit
You've read 0 of 1 free Pro articles.
It seems I’ve kicked a hornet’s nest with my article from earlier this week. That’s OK, I don’t mind a little controversy.
Just to be clear, I believe the FOMC will cut by 25 basis points on September 18. The FOMC should cut by 50 bps, but a 25 basis point cut is much more likely.
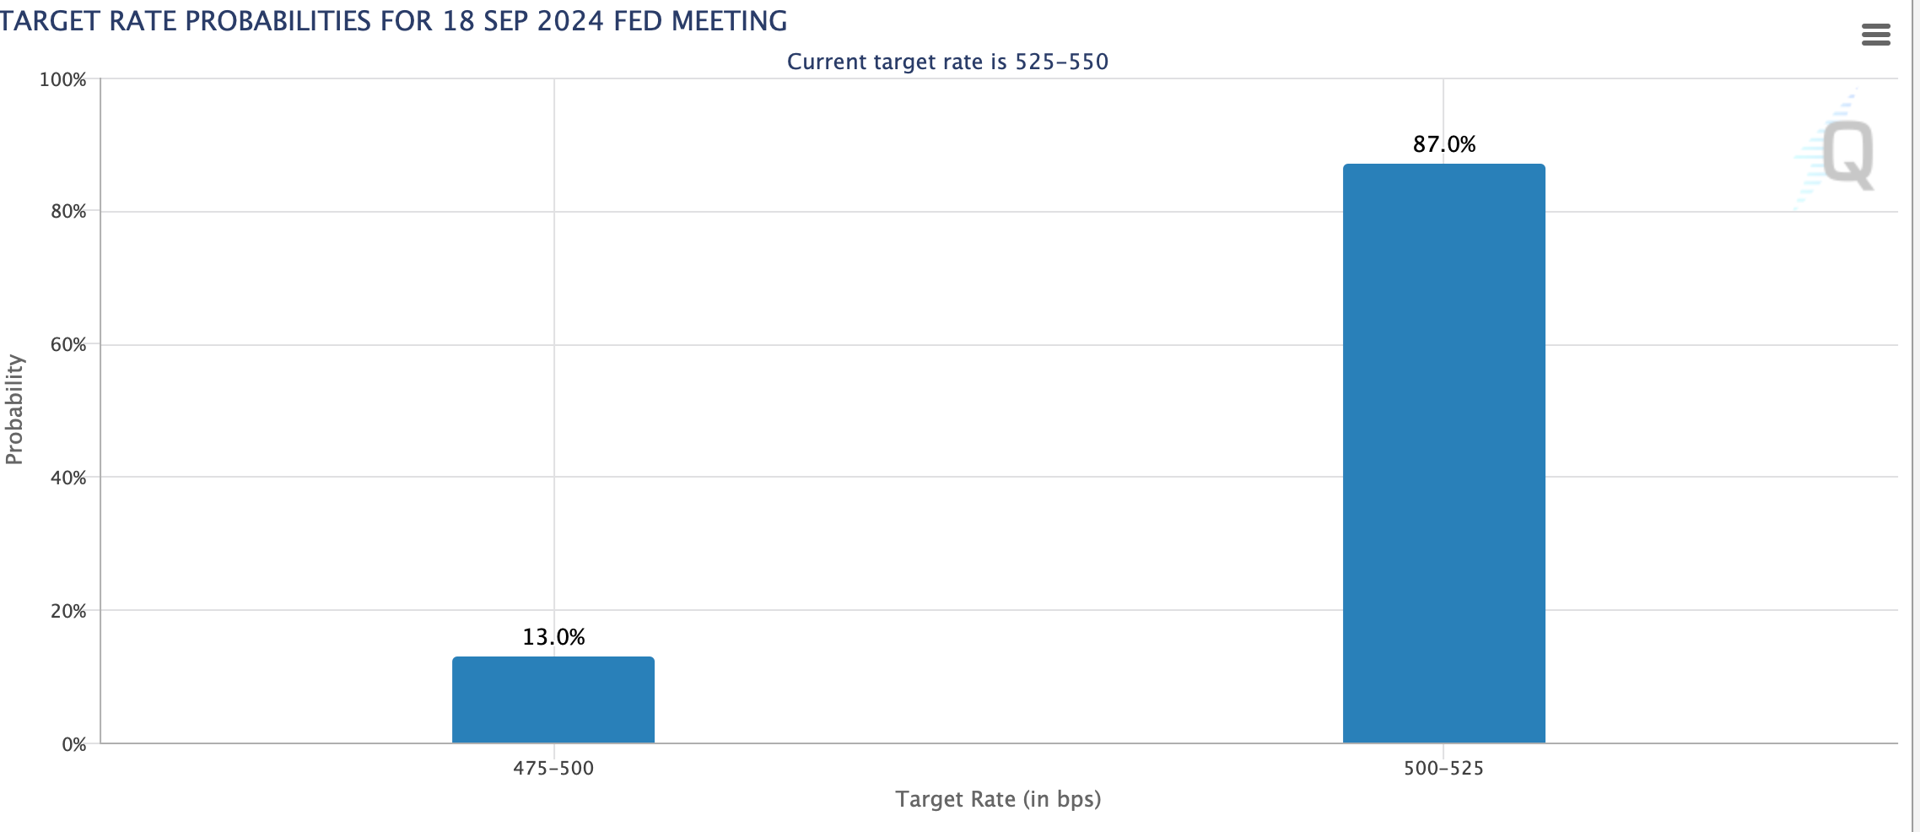
I’m not alone in this belief. After Wednesday’s consumer price index (CPI) data, the odds of a 50 basis point reduction in the Fed funds rate stand at just 13%, according to the CME’s FedWatch tool. There is now an 87% chance of a 25 basis point cut.
I cited some employment statistics in an earlier article, in an effort to demonstrate that the economy is weaker than it appears. While that information remains relevant, there is much more to this story.
Commodities Bellwether
First, let's look at a bellwether for commodities prices — the Invesco DB Commodity Index Tracking Fund DBC. DBC includes commodities from the energy, metals, and agricultural sectors.
DBC’s chart reveals a downward trend that has been in effect for nearly a year.
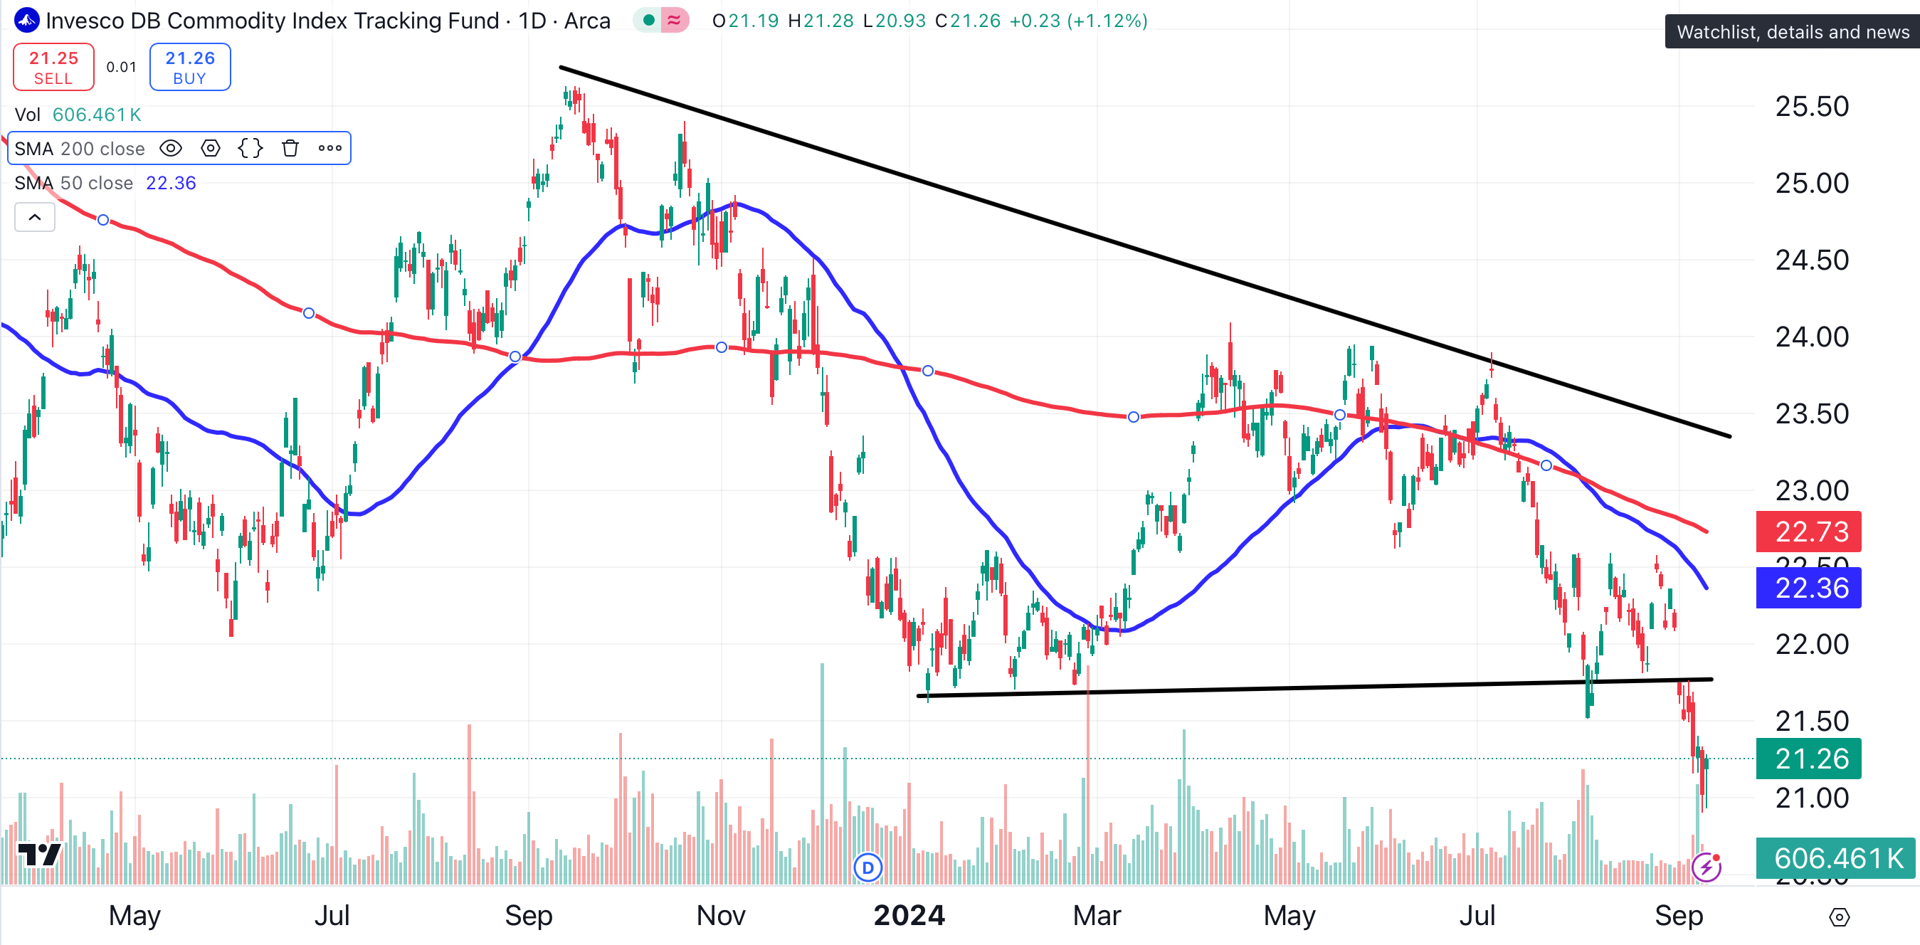
That trend has accelerated, as DBC recently traded at its lowest point in over two years. Note the breakdown from the bearish descending triangle pattern, as well as the negative trend of DBC’s 50-day (blue) and 200-day (red) moving averages.
Dr. Copper
Copper has lost 20% of its value since peaking in mid-May. Like DBC, the red metal trades below its key 50-day (blue) and 200-day (red) moving averages.
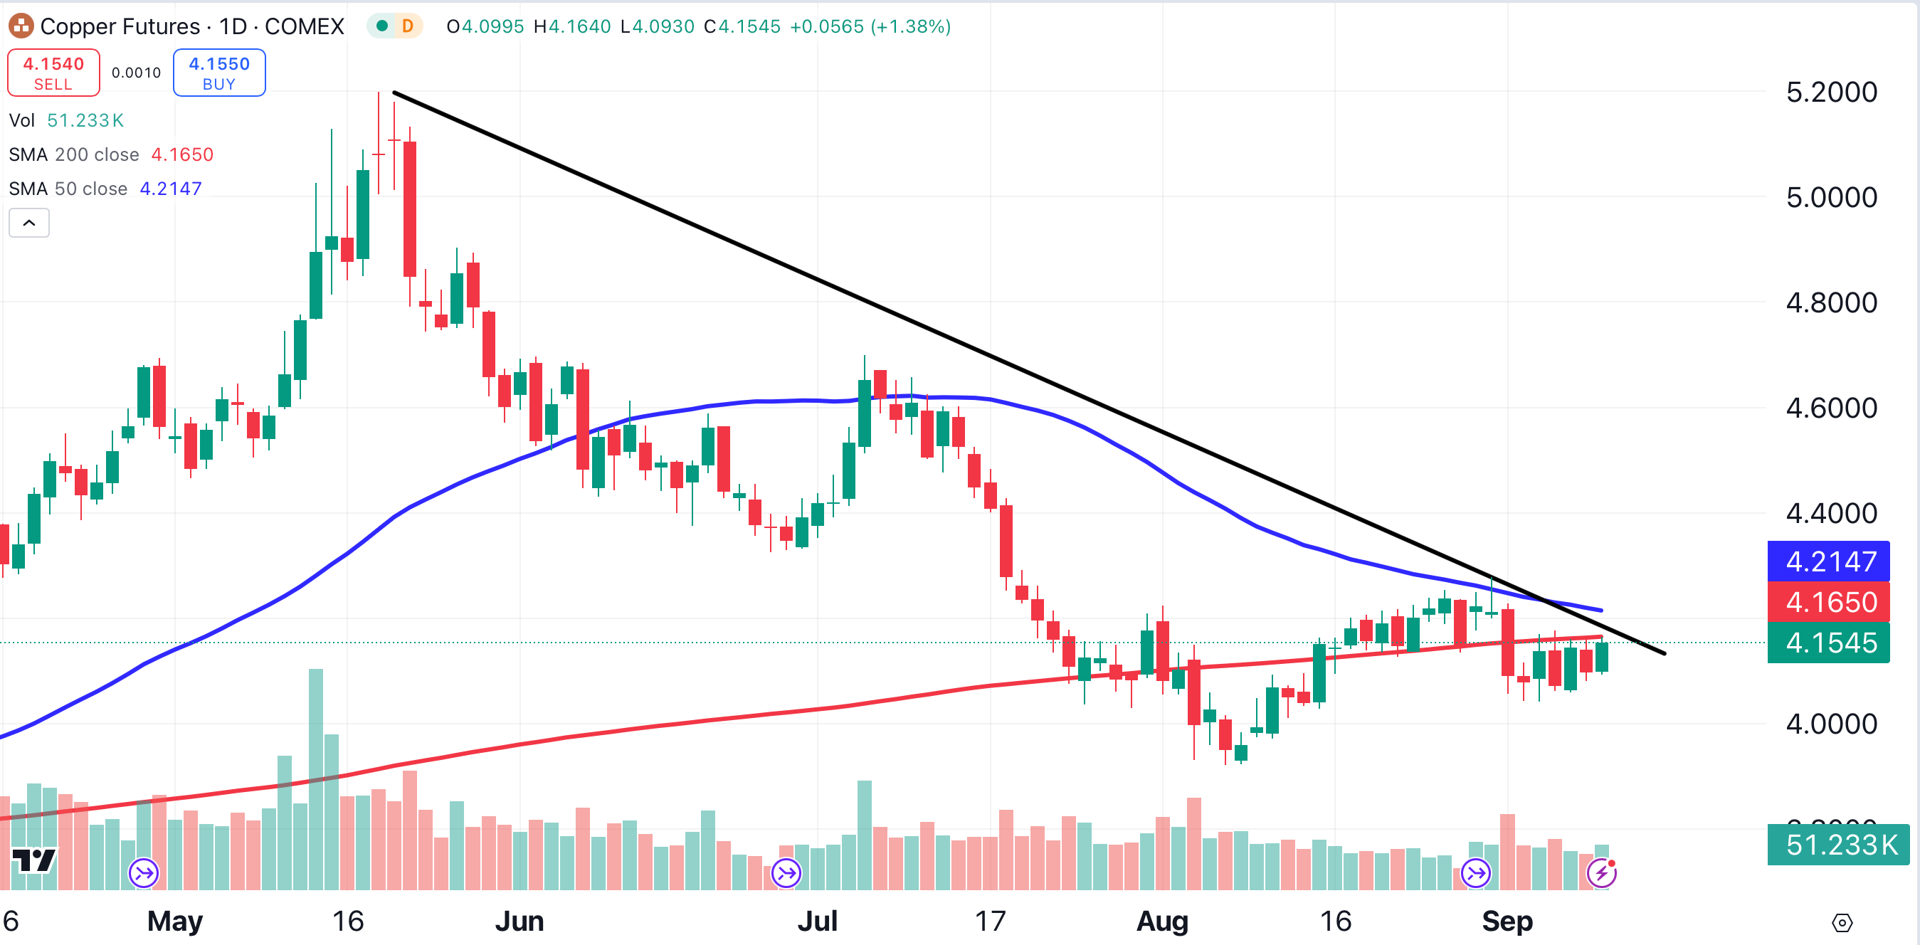
Why do investors call this commodity ‘Dr. Copper”? Copper prices are a predictor of economic growth, since it is used in industrial and manufacturing processes. The 20% drop in price reveals a lack of demand, particularly from China, the world’s biggest purchaser of copper.
Dr. Copper doesn’t operate alone. The good doctor has several associates I’d like you to meet.
Crude Oil
Like DBC and copper, crude oil is trending lower, and has fallen beneath its key moving averages. Last week, West Texas Intermediate crude oil reached its lowest point in over a year.
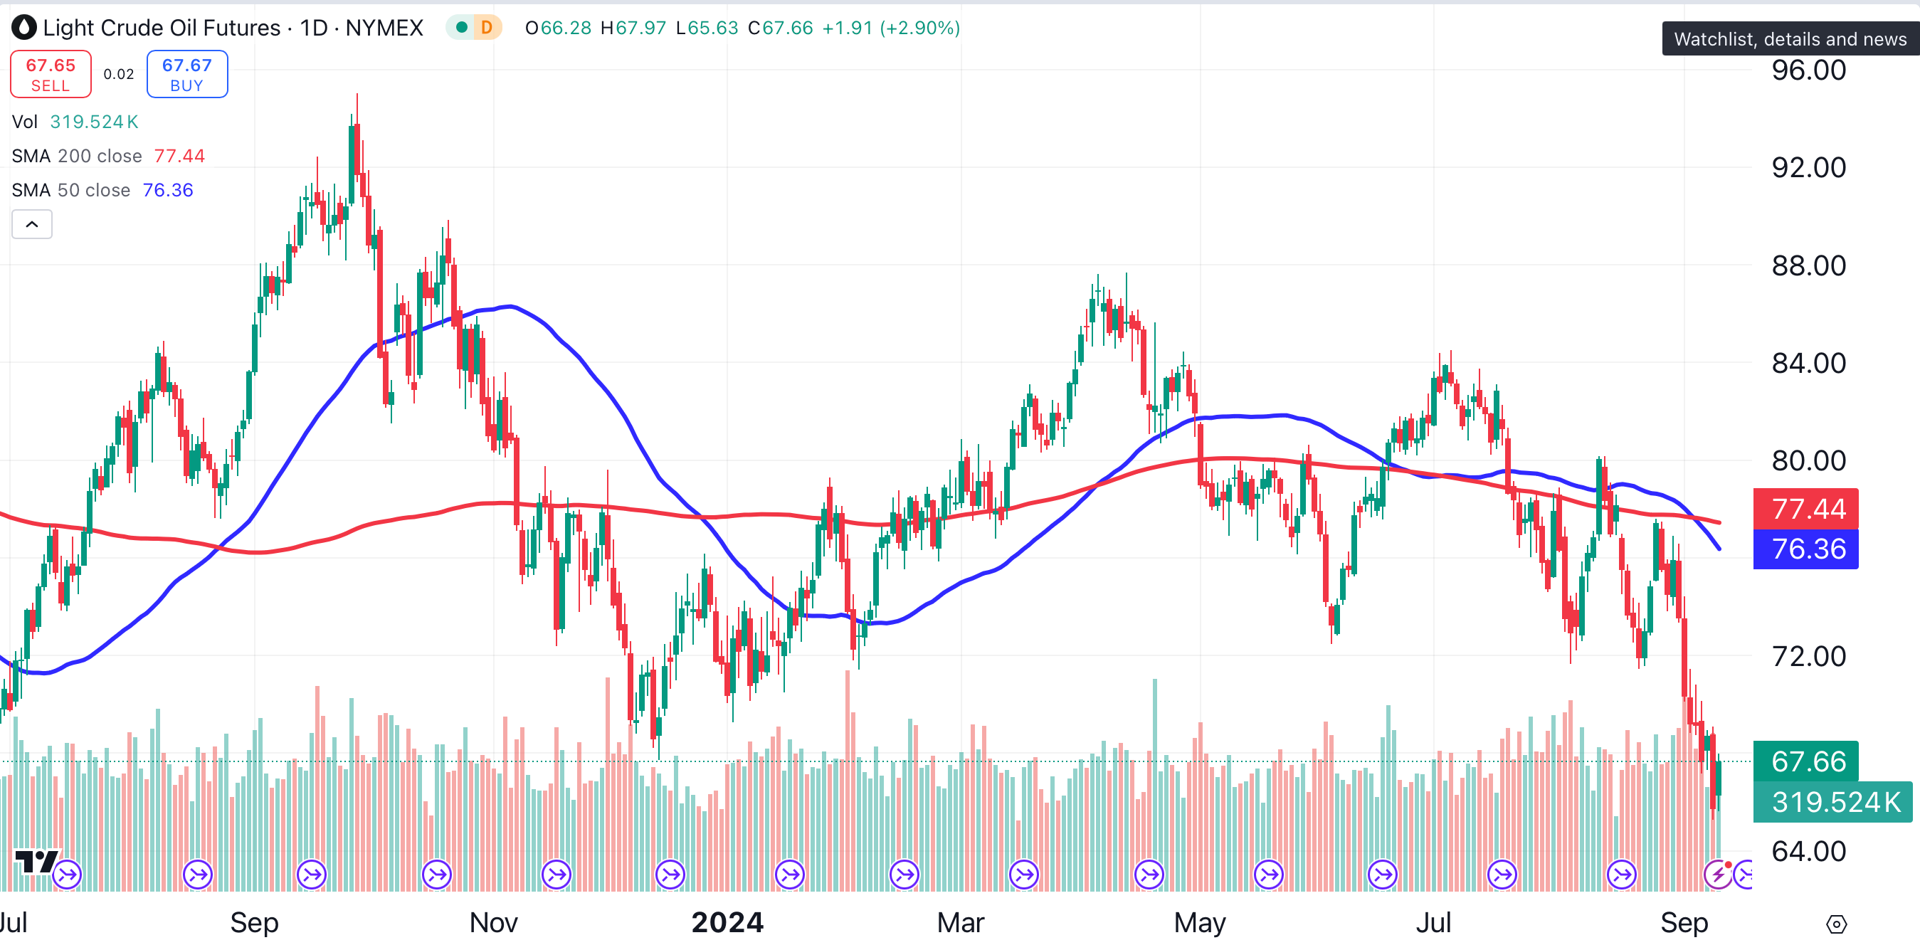
The price of oil is driven by supply and demand. Demand for oil falls when the economy weakens.
The fact that crude prices are reaching 52-week lows now is an indication that demand for oil will be softening in the future, as cracks in the economy become more apparent.
Iron Ore
Iron ore is primarily used in the production of steel, and steel is a key component in construction. Last week, the spot price of iron ore reached a 52-week low.
Like DBC, copper, and crude oil, the price of iron ore is trending lower and has fallen beneath its key moving averages.
Notice how the iron ore chart, below, looks similar to that of crude oil, above.
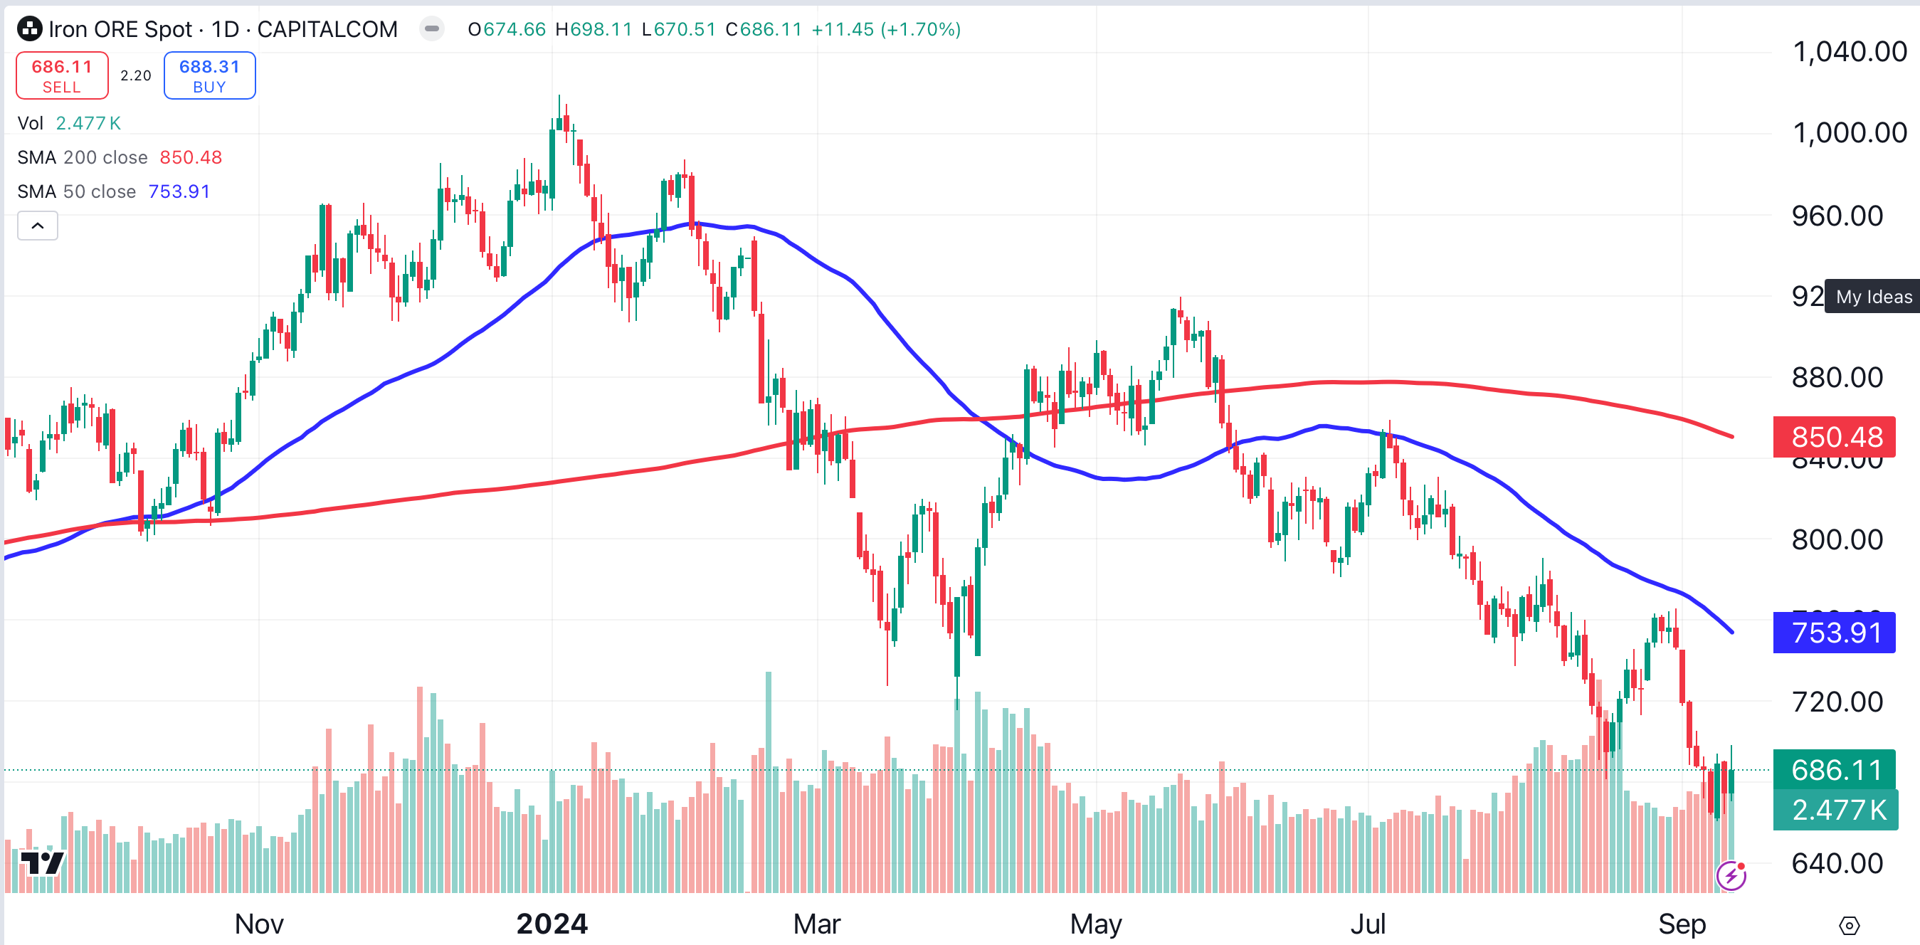
All of the above charts speak to weakening demand. If the job market is as weak as I believe it to be, as indicated here, then it becomes easier to connect the dots.
If one or two of these charts displayed weakness, I’d be a little concerned. When all four of them at once are pointing in the same direction, my confidence in the economy begins to wane.
In summary, the FOMC will likely cut the Fed funds rate by 25 basis points on September 18.
That's unfortunate. Based on current weakness in employment, and on softness in commodities prices, a reduction of 50 basis points would be the correct move.
At the time of publication, Ponsi had no positions in any securities mentioned.