The VIX Takes the High Road
Let's check this curious reading on the Volatility Index, interpret the indicators, and take a look at the charts of Nintendo, Disney, Ethereum and more.
You've reached your free article limit
You've read 0 of 1 free Pro articles.
The Market
I would love to report to you that the indicators changed today, but they did not. The one thing I find very curious is that the Volatility Index hasn’t gone lower, despite the rise in the S&P 500. Perhaps it’s year-end stuff, but it’s curious. And it’s one of the reasons I continue to think we are due a bout of volatility.
I have been pegging early 2024 as a time for a pick up in volatility, but I will continue to confess that I am not sure we can make it to the end of the year. I know it is only eight trading days away, but we have now been green for nine-straight days on the Nasdaq and eight of nine days for the S&P 500.
Even as far as sentiment goes, it doesn’t seem like folks have gotten more bullish than they were. We will see what the Investors Intelligence report is tomorrow, but even if bulls are 58% and bears are 17%, is that meaningfully different than where we are now with 56% bulls and 19% bears? I think not.
The big shift might come from the National Association of Active Investment Managers Exposure Index, which we will see on Thursday morning. But even the put/call ratios don’t get "more" bullish. Even the Daily Sentiment Index readings are lower (for stocks) than they were a week ago. The DSI for the S&P is at 81 and Nasdaq is 83. So, if this market keeps on heading upward until year end, those readings really ought to be over 90 by then. Finally, I see the topic of conversation has begun to center around the RSI (Relative Strength Index) as a sign we are overbought. Heck, we have been overbought for weeks now and the market doesn’t care. We have seen the indicators get overbought and churn. I’m not saying the RSI will or won’t do that (I don’t use the indicator, so I am not an expert) but I would just add it to the list; it’s not new information.
I would make one other point. The bonds haven’t budged in days. They might push upward again tomorrow (rates down), but thus far they have taken a rest. And I still think there are not enough (any?) bulls in the energy patch.
New Ideas
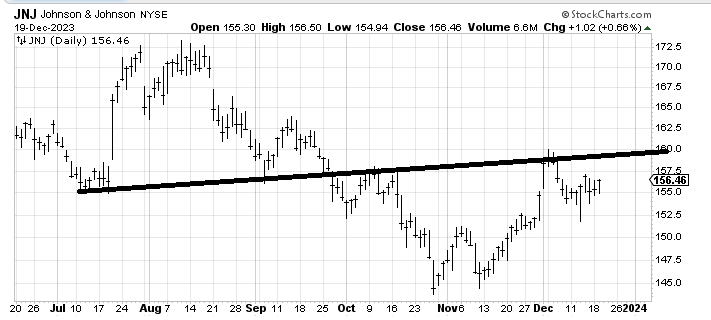
Johnson & Johnson JNJ, a name I recommended a week ago, has moved up, but not nearly as much as I expected it to. I still think it works higher.
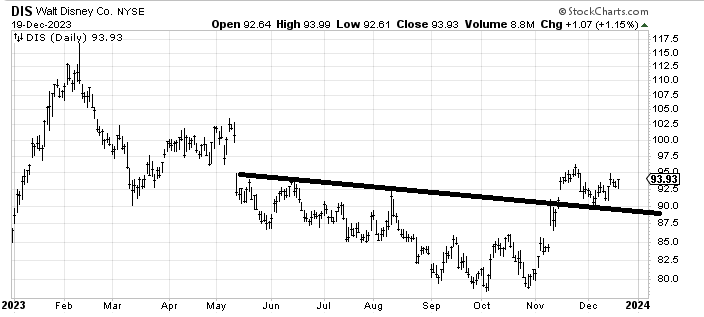
To follow up with the person who asked about Disney DIS recently, it did not come down to $85, but rather bounced off $90, and I wouldn’t be surprised if it still wants to fill that gap near $100.
Today’s Indicator
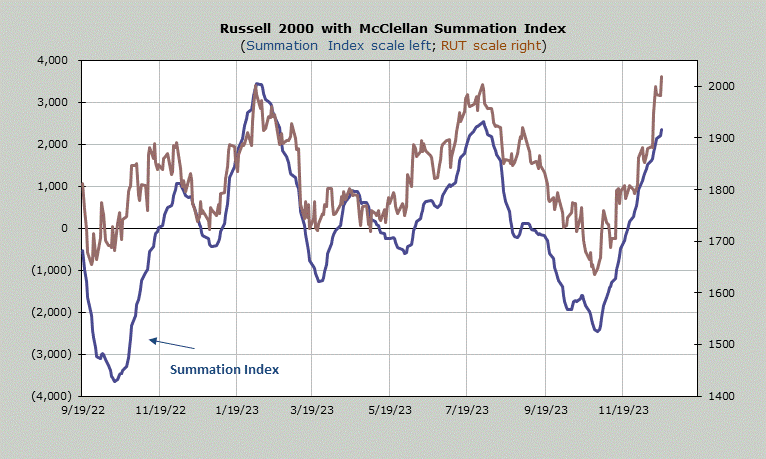
The McClellan Summation Index is still rising. It needs a net differential of -2,300 advancers minus decliners on the New York Stock Exchange to halt the rise.
Q&A/Reader’s Feedback
Helene welcomes your questions about Top Stocks and her charting strategy and techniques. Please send an email directly to Helene with your questions. However, please remember that TheStreet.com Top Stocks is not intended to provide personalized investment advice. Email Helene here.
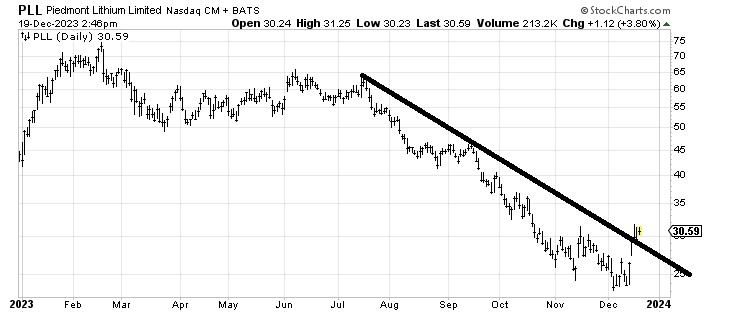
Benefit of Doubt for Piedmont: Piedmont Lithium PLL is a chart trying to bottom and now that it crossed the big downtrend line, I’d say it’s OK. I would, however, prefer to see it retest the downtrend line (come down a few points and tag the line), but until it goes back under the line, it gets the benefit of the doubt.
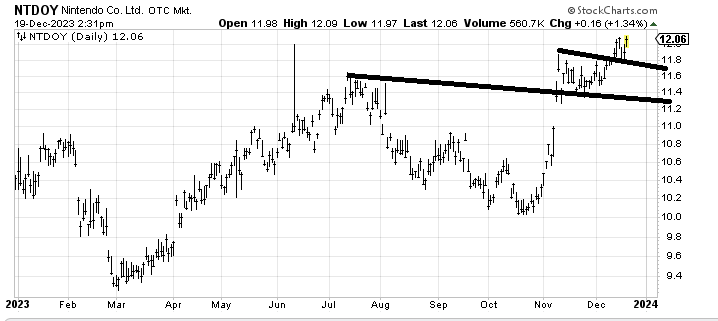
Game for Nintendo?Nintendo NTDOY is not my kind of chart, because it is at the top of the page. There is a measured target around $13, so unless it trades back under $11.80, it ought to make its way there.
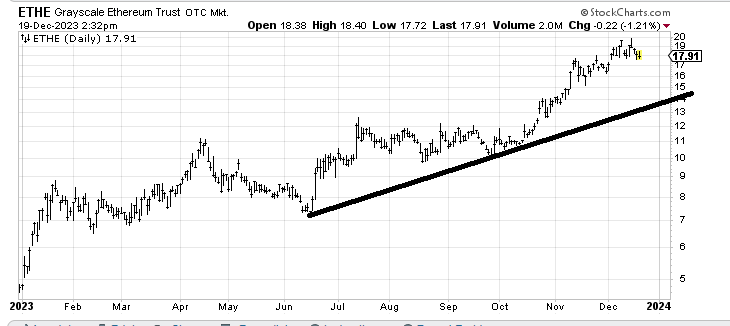
Running out of Ether: Ethereum Trust ETHE hasn’t really don’t anything wrong yet, but I’d pay close attention, because it hasn’t been able to make a new high in a few weeks. Considering these crypto currencies were leaders off the lows and tend to be where speculation lives so if this does rollover, like bonds and gold and the buck, it’s likely a sign of exhaustion.
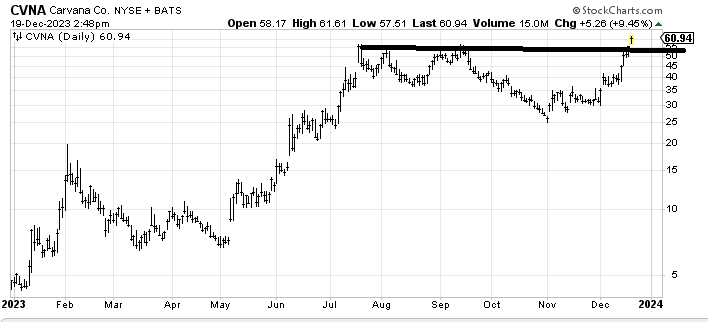
Will Carvana Get Trapped on an Island?I do not like charts at highs so I am not going to like Carvana CVNA but at the same time, it hasn’t done a thing wrong. So unless it turns back under $50 or starts making lower highs, it’s a positive chart. The one thing that would make it bearish is if it gaps down under $50 and leaves today’s action as an island.
Positions: None.
