The Russell Is Behaving Differently This Post-Election Year
Past years have seen decisive breakouts. But not this year, so far.
You've reached your free article limit
You've read 0 of 1 free Pro articles.
So the index movers took the market down on Monday. But as we know that wasn’t the first day of the decline. Heck, the Dow has been red for five of the last six trading days. The Transports haven’t seen a green day in more than a week. The Utes have been red nine of the last eleven trading days. The Transports are down 5% and the Utes have lost 6%.
I could go on but we know that breadth has been negative for more than a week so Monday was not the start of it, it was more like the high flyers catching up to the rest of the market.
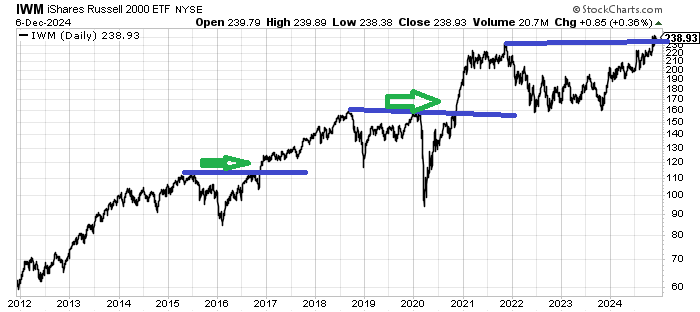
But I want to discuss the chart of IWM today. I have noted several times in the last month that this post-election rally looks and feels quite different to me than the last two post-presidential elections.
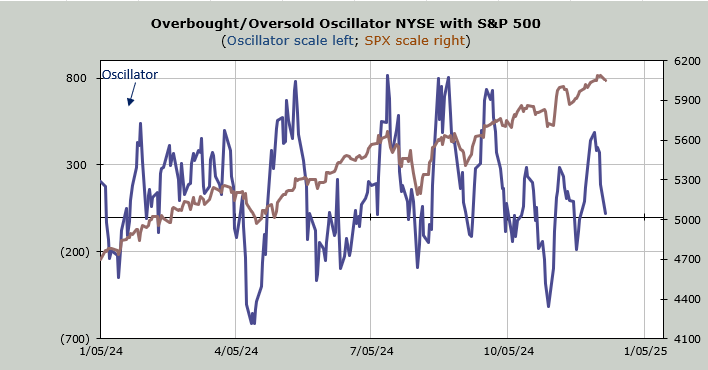
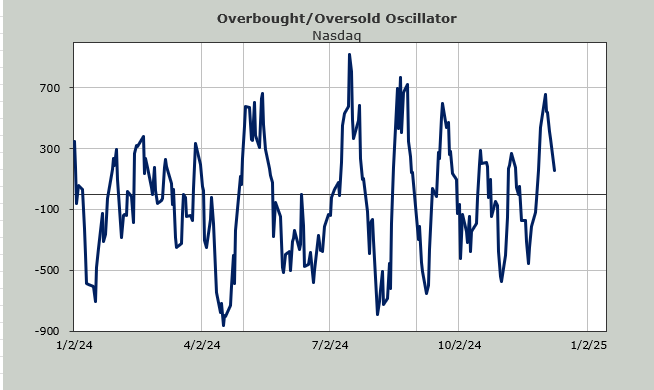
For starters, we did not come into this election intermediate-term oversold and with super bearish sentiment the way we did in the prior two. But then there is the longer-term chart of IWM. I know many believe that the small-caps ought to play catch up. Heck, I love it when the ‘others’ rally because there is more choice; it’s as if we’ve gone to the buffet of stocks with so much to choose from rather than the diner from Saturday Night Live way back when. You know the one I am referring to, the place where they only served cheeseburgers. No Coke, Pepsi. That was all they sold.
Look at the long term chart and you can see almost immediately after the elections of 2016 and 2020 (green arrows), the IWM broke out of a multi-year sideways. In both cases, it was done with a week of the election and by the time we got to mid December, a month after the election, IWM was on its way.
But now a month after the election, it is still sitting at the old highs from 2021. I would love nothing more than to see this breakout, but my point is that the other two did so immediately and this one has not. That’s different.
Had this surged up and over 240, busting out the way it did in 2016 and 2020, then I would say it looks similar in its reaction. If it does it in January then it will be a breakout, but it won’t look similar because it took six or eight weeks to do so.
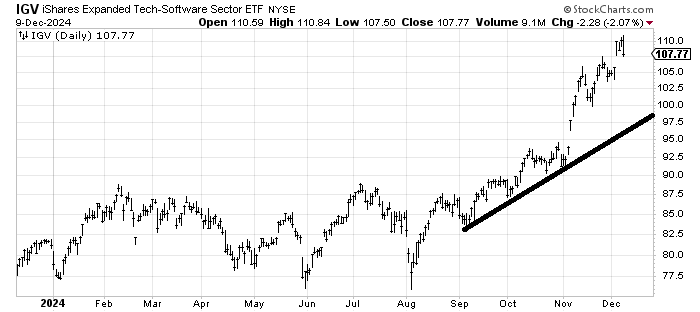
There was very little, statistically, to report from Monday’s action. It was the reversal in the recently hot stocks that got things going on the downside. I said last Thursday charts like IGV, an etf to be long software names, needed a correction. I still feel that way. They are over-extended, even after Monday’s reversal.