The Question Is: When Will the Nasdaq Be Oversold? The Answer Lies Within.
Let's check in on the indicators and see exactly when the Nasdaq should be oversold.
You've reached your free article limit
You've read 0 of 1 free Pro articles.
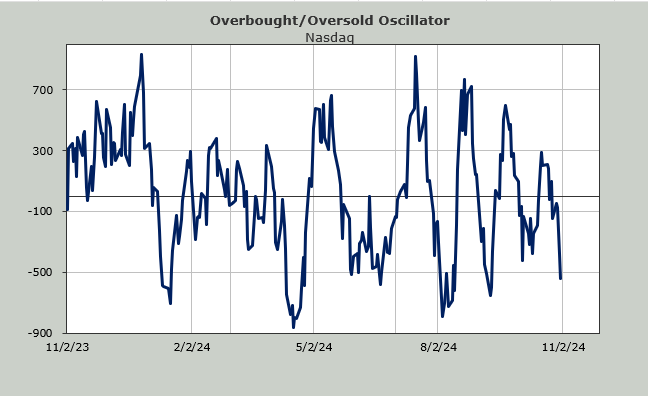
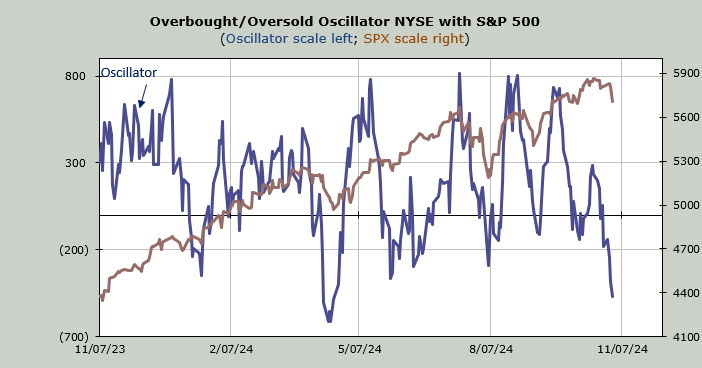
My Overbought/Oversold Oscillator is now closing in on where it was in mid-April. The S&P hasn’t caught up yet, but Thursday’s action was helpful as the S&P fell to its 50-day moving average for the first time since mid-September.
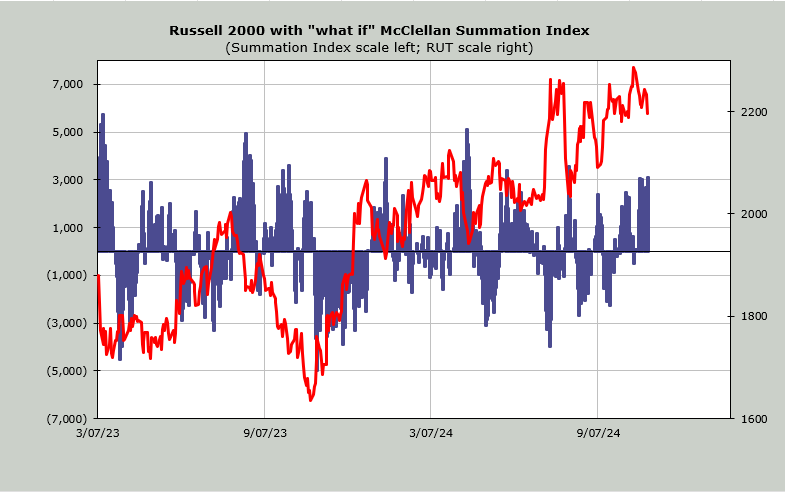
Then I like to look at what it will take for the McClellan Summation Index to halt the decline it has been in for the last month (it rolled over in early October and hasn’t changed since). It now requires a net differential of +3100 advancers minus decliners on the NYSE. It has been milling around this area for a week now. Notice that in April, it got all the way to +5000. It feels like it needs a spike to me.
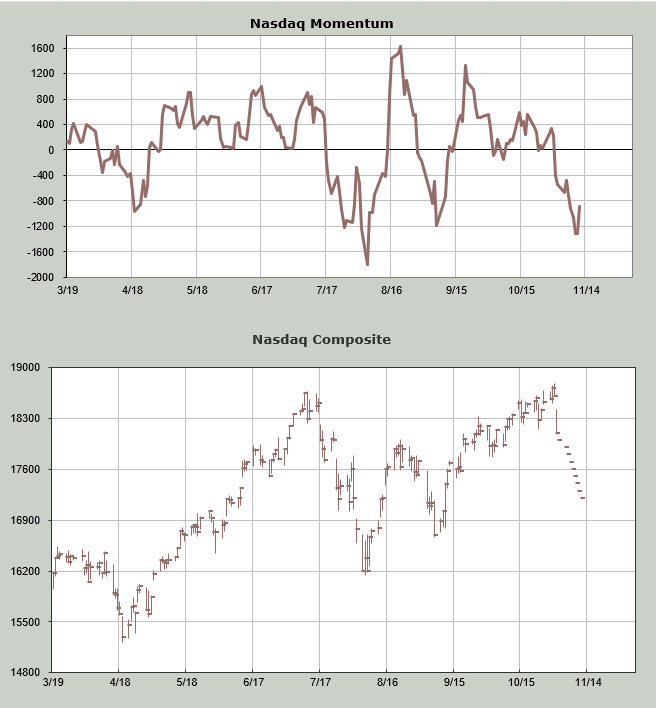
The other short-term oversold indicator I like to use is the Nasdaq Momentum Indicator. What I do here is walk Nasdaq down about one hundred points a day every day until price keeps going down but the indicator turns up. That is the definition of oversold: when the price keeps going down, but the momentum turns up. The exact date is November 9th.
Please keep in mind that the exact day is not what counts, but we usually have to get a bit closer to it (we are basically still ten days away now). I will continue to update this next week.
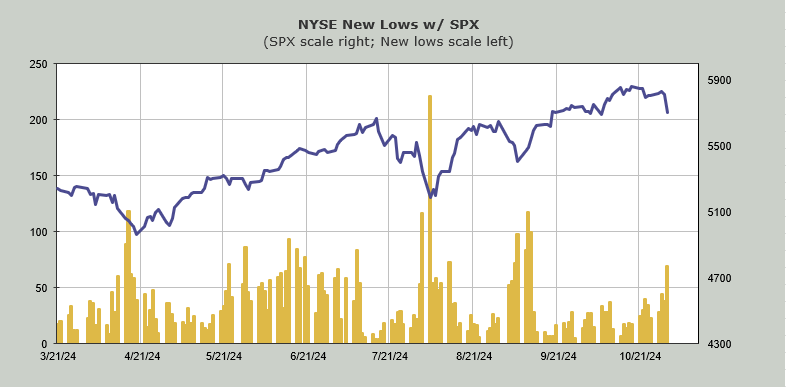
So that’s the good news on a short-term oversold condition: we are getting closer. The intermediate-term is not there yet, though. For example, the number of stocks making new lows expanded quite a bit on Thursday. You might recall recently, I did this exercise with you where I said I ask myself if we see the S&P comes down to the mid-September low, do I think there will be fewer stocks making new lows? My answer was no. And you can see that new lows are now the highest since August. It is always my preference to see the new lows contract.
I did not get the sense that selling was terribly panicky on Thursday, as a mere 72% of the volume was on the downside. In fact, Nasdaq had its first consecutive days with net negative volume (up minus down) since the final days of August. That’s quite a change.
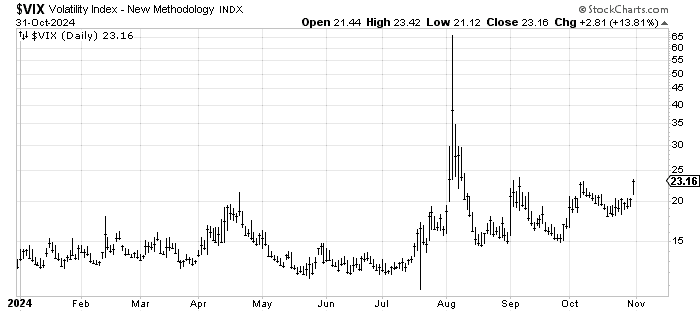
But we did finally see the VIX head into a jumpy situation. Last week, I said when we see a chart like this that looks like a bottom, we want to see the VIX emerge from that bottom and look like you can’t wait to buy the chart. That’s usually the point that it gets jumpy. It’s close now.
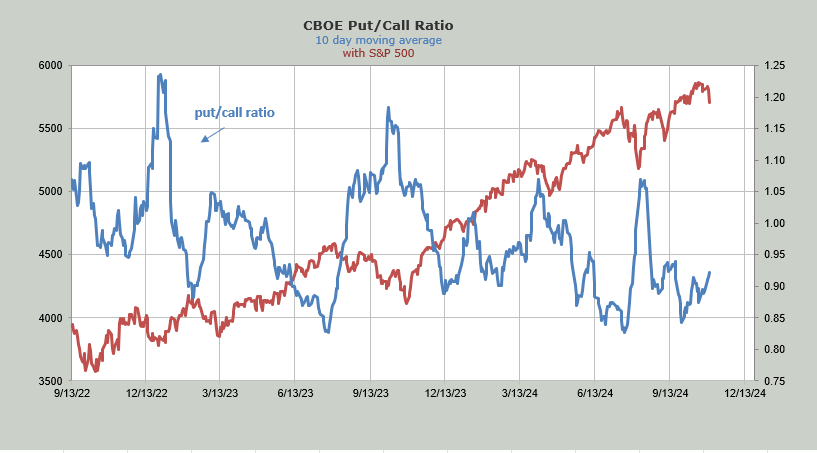
The put/call ratio was 1.0 on Thursday, which, to me, is not exactly a ‘fear’ number. The ten-day moving average is still under .95. A move up to the 1.05 area would tell me folks are finally scared.
I want to end by reminding you that I think everyone is looking at the last two presidential elections as a template for what the market will do. The set-up is a bit different this time (we were intermediate term oversold in both of the prior two elections). But I just want to take you back to the year 2000 when we did not know the result of the election until mid December. And the market sold that resolution.