The Question Is, Are We at ‘Buy the Dip’ or ‘Disbelief’?
Despite the damage in many stocks, sentiment is nowhere near fear.
You've reached your free article limit
You've read 0 of 1 free Pro articles.
As promised, we’ll begin with a review of some of the intermediate-term indicators. We’ll finish with sentiment, which I still view as too bullish. In fact, as you look at the intermediate-term momentum and breadth indicators, you will notice how several of them are the lowest we’ve seen in more than a year, yet every sentiment indicator is still at or near an extreme for bullishness.
On Friday the major indexes made lower lows not long after the market opened and for the first time in a while, there were fewer stocks making new lows. The NYSE saw 173 stocks at new lows vs. 259 the day prior. Nasdaq had 272 new lows vs. 347 on Thursday.
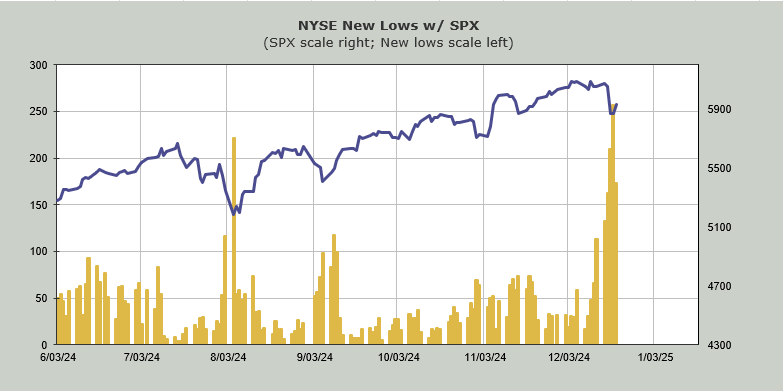
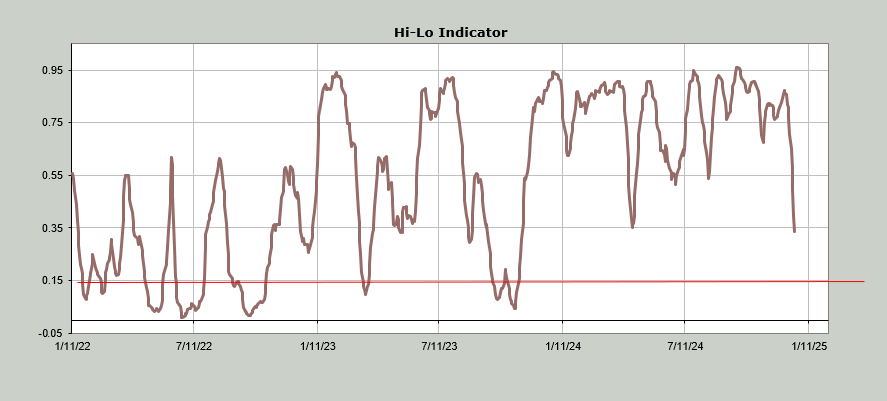
This brings us to the Hi-Lo Indicator, which for Nasdaq is currently at .40. The NYSE is now at .34. The NYSE gets intermediate-term oversold under .15 while Nasdaq does so under .20. Note this is the lowest reading for the NYSE in more than a year.
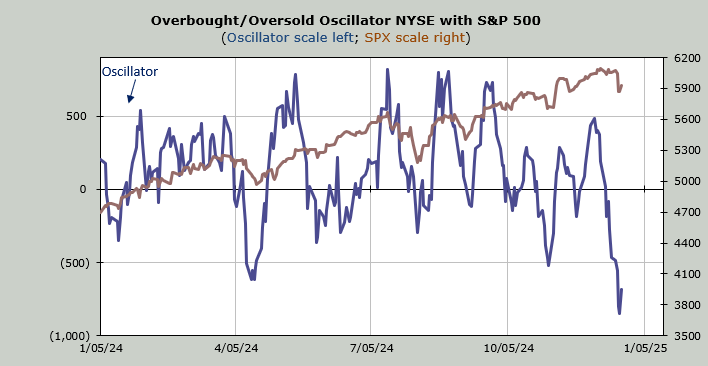
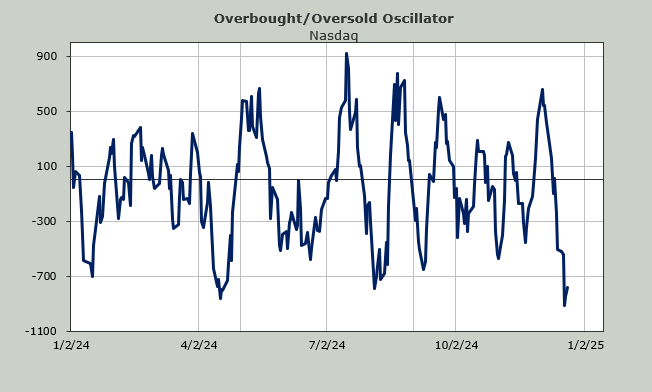
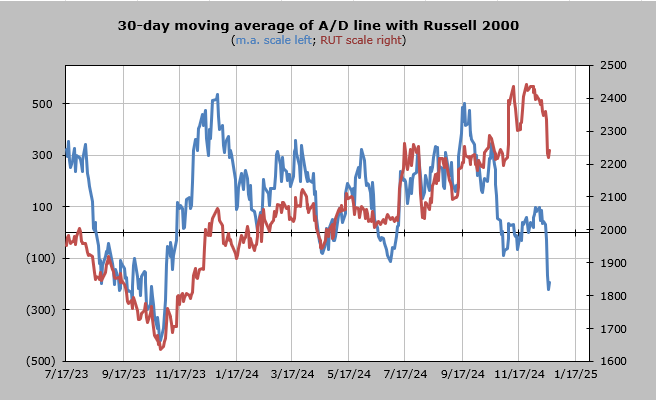
The 30-day moving average of the advance/decline line, what I use as an intermediate term Overbought/Oversold Oscillator, is the most oversold it has been since the October 2023 lows. The math says it may go lower but I would consider this moderately oversold now.
Let me note why I use the word moderately. While breadth has been terrible in the last month there haven’t been that many days with net negative breadth readings over -1000. When we are dropping quadruple digit readings I would use ‘oversold’ without the modifier. However a lot of the negative readings we are dropping are much more ‘moderate’ and not extreme.
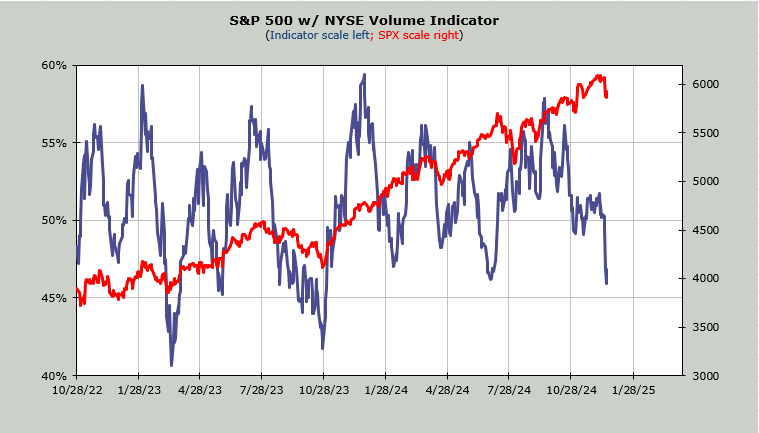
We looked at the Volume Indicator on Friday, but to reiterate, this is oversold as it got down to 46% on Thursday. Sure, it can go lower, but it is into the top of the oversold zone. Even in the worst bear markets, this rarely breaches 40%.
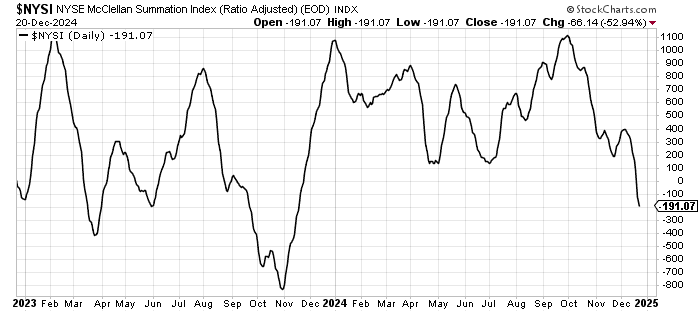
The McClellan Summation Index is heading down and firmly under the zero line for the first time in more than a year. As you know from last week it got to the point where it needed +5200 advancers minus decliners on the NYSE to halt the decline after Wednesday’s whack and that did not change with Thursday’s decline which made it oversold. Now it needs +3200.
Now let’s check in on sentiment which came off the boil a bit last week but I see no fear, and certainly not commensurate with the amount of damage done in the majority of stocks. The clearest example I can offer is the 30 day moving average of the equity put/call ratio. It now stands at .54. As you can see on the chart this is the low end of the range for the last two decades.
Notice how so many of the momentum and breadth indicators are closing in on levels not seen since the October 2023 low yet at that low this sentiment indicator was pushing out of the top of the range at .82. That’s quite a divergence in sentiment vs. breadth, isn’t it?
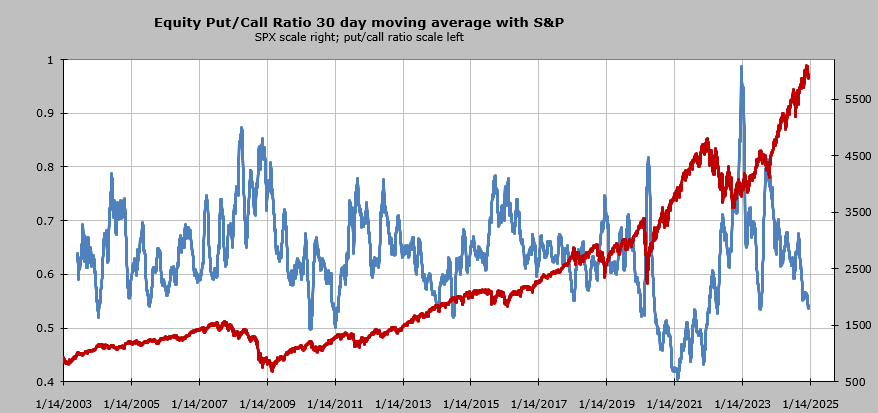
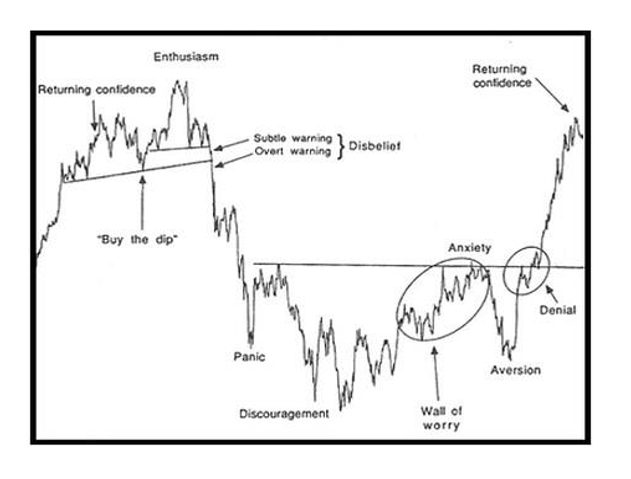
In terms of sentiment and the Sentiment Cycle, first used by my mentor in this business (Justin Mamis), I’m not quite sure if we are at ‘buy the dip’ or ‘disbelief’. Or maybe some stocks are in one place while others are in another. Many of the 493 are surely much closer to the bottom than the top. Either way I think we can all agree we are far from Panic or even Discouragement. And that’s the difference between now and the other times the indicators were getting oversold.