The Market's 'Check Engine' Light Is Blinking
Something's not right under the hood, so let's take a look. Also, we have lots of stock charts to check, including Apple, Delta, Shake Shack, and the gold fund.
You've reached your free article limit
You've read 0 of 1 free Pro articles.
The Market
Here’s where we stand: We are short-term oversold and we can’t seem to rally (more on that below). We are not intermediate-term oversold.
Typically, the market would have rallied — and by rallied I mean more than the big caps — for a few days. Heck, go back to late August and recall that rally into Labor Day. Go back to early October and recall that rally the first few days of the month. Even mid-October we had a few days of rallying before heading down again.
Is it just a hangover from December or is it more? When the Russell 2000 broke out, everyone got quite excited. But I gave it a chance to hold from a bit lower than obvious support, because it really had gotten ahead of itself. It has not been able to rally at all.
We have developed a bit of a pattern in the market lately, where we open with a gap down and the selling dries up and the big-cap stocks rally into the end of the day. It therefore keeps the major indexes from having a big down day. But, under the hood, as we have discussed, there is deterioration everywhere -- just not in the big caps.
Notice I am not using "Magnificent Seven." That’s because it’s more than those stocks, or even 20 stocks. It’s a majority of the Dow stocks. Not all of them, but look at Visa V, or Walmart WMT or IBM IBM, or Travelers TRV, or JP Morgan JPM, etc. The only thing those stocks have in common is they are large cap and in the Dow Jones industrial average. There is no selling in them.
You already know how poor breadth has been. At one point today, the New York Stock Exchange had 91% of the volume on the downside. It ended the day at 85%, same as yesterday. That’s what you see when there is a great deal of selling going on.
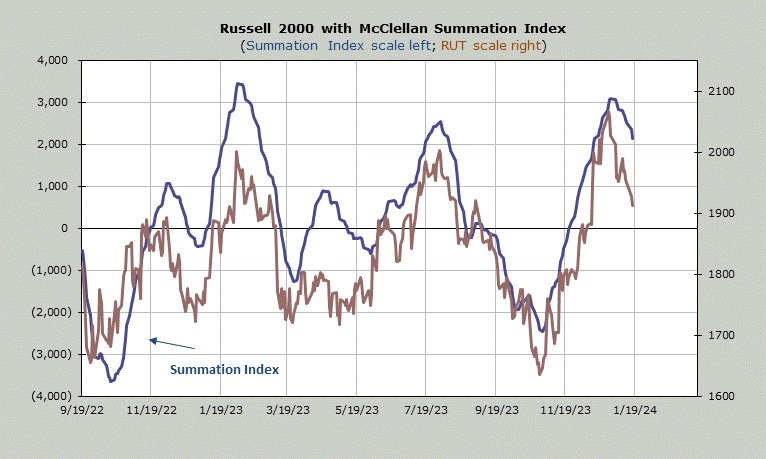
Look at the McClellan Summation Index. It has clearly rolled over. It would require a net differential of 3,900 advancers minus decliners on the NYSE, just to halt the decline. At +4,000 we step a toe into extremely oversold.
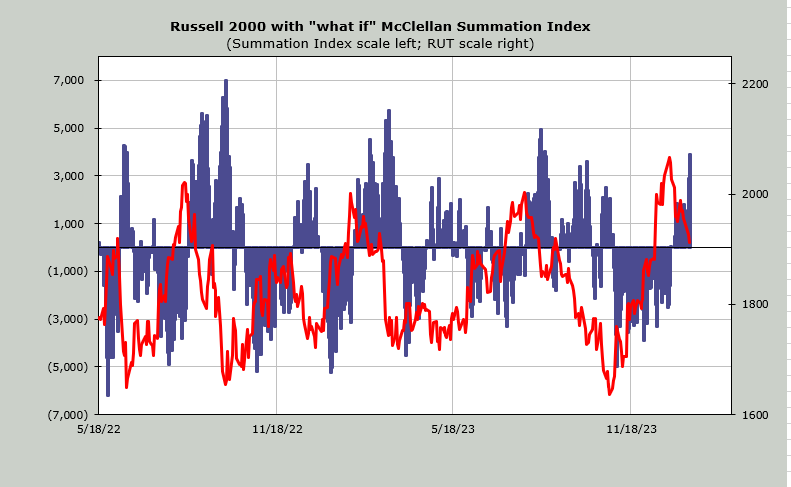
For Nasdaq, I use volume and here it needs +6.8 billion shares to halt the decline. That’s more than it needed in the entire third-quarter decline. While it is not the same, notice in the fall of 2020, Nasdaq hung up there as the "what if" for its Summation Index kept rising. Eventually Nasdaq itself came down, as well.
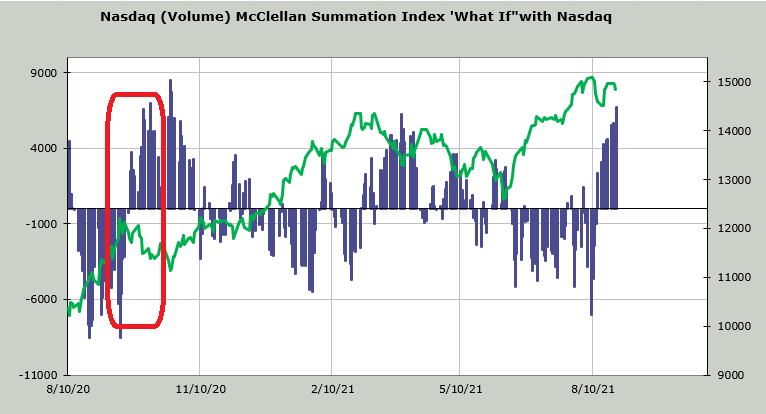
What I am saying is something needs to be resolved in the market. Either the big caps need to come down or the rest of the market needs to rally. My contention has been the latter but that has been wrong.
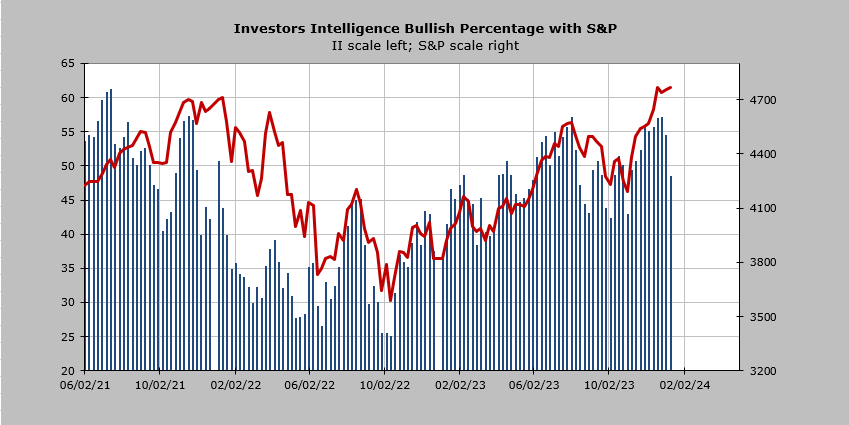
I will end with one final note on sentiment. The Investors Intelligence bulls are down nearly 10-points in the last two weeks so at least we are seeing the bulls pull in their horns.
New Ideas
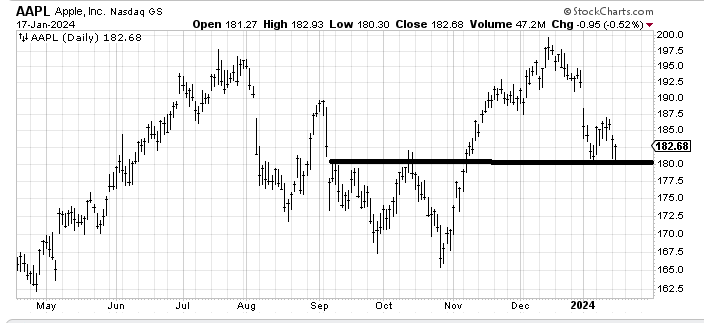
Apple AAPL doesn’t seem to be as chattered and fussed about as it used to be, probably because it’s been a dog. I don’t love the chart of Apple, but I can tell you I am watching that $180 area very closely. If it holds and we get an oversold rally, Apple could try and fill that gap overhead around $190. If it breaks, I would think $173-$175 comes in a hurry.
Today’s Indicator
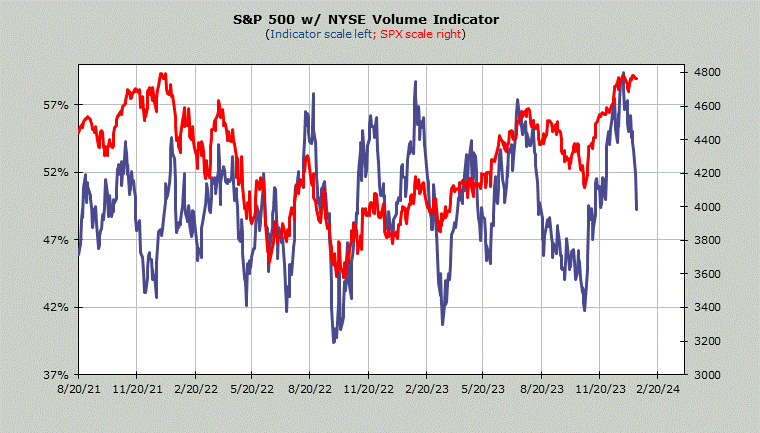
The Volume Indicator has moved. It is now 49%. In a bull market under 47% is oversold. In a bear market it’s closer to 42%.
Q&A/Reader’s Feedback
Helene welcomes your questions about Top Stocks and her charting strategy and techniques. Please send an email directly to Helene with your questions. However, please remember that TheStreet.com Top Stocks is not intended to provide personalized investment advice. Email Helene here.
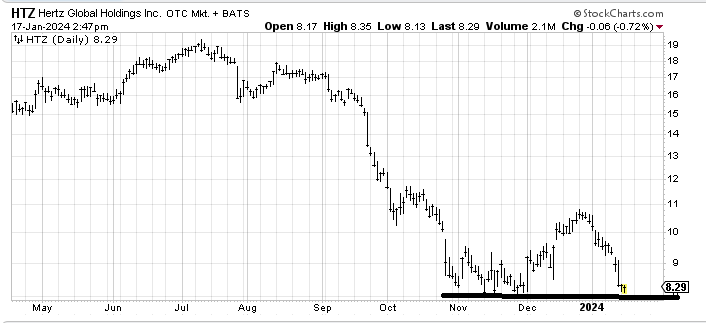
When to Get Into Hertz: If you want to bottom fish in Hertz HTZ, then you know you’re wrong under that line. Quite frankly if the market were intermediate-term oversold I’d be willing to take a chance since the risk/reward is decent but the market has not been kind to bottom fishing so I’d wait for more proof it wants to hold.
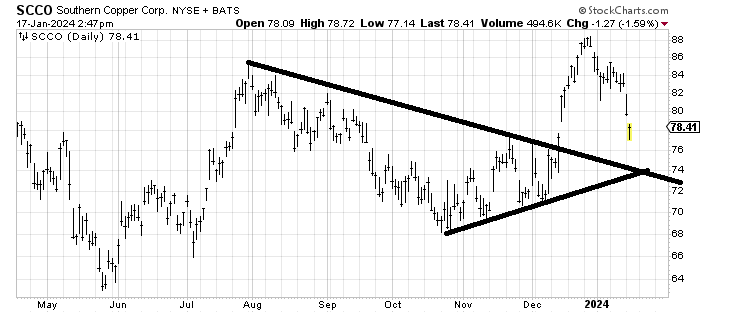
Copper Tarnishes: Southern Copper SCCO closed the gap and is pretty oversold, but that’s the best I can say about it If it managed a rally to $82, I’d be a seller. If, by the time we get intermediate-term oversold, the stock is near that line around $74, I might be willing to look at it on the long side.
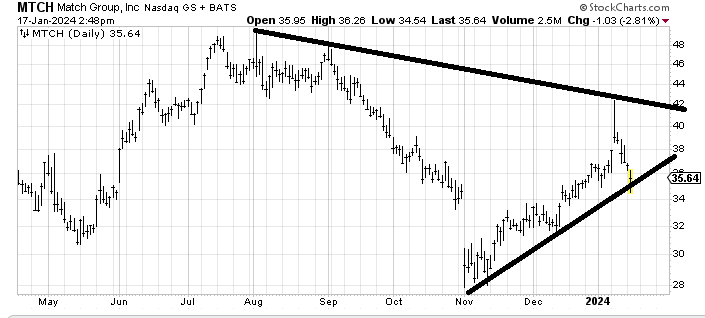
Match Maker: Match MTCH looks like it had a short squeeze and is now heading back down. Sure it should bounce from this line but again, without an intermediate-term oversold condition, it seems too soon to do more than bounce.
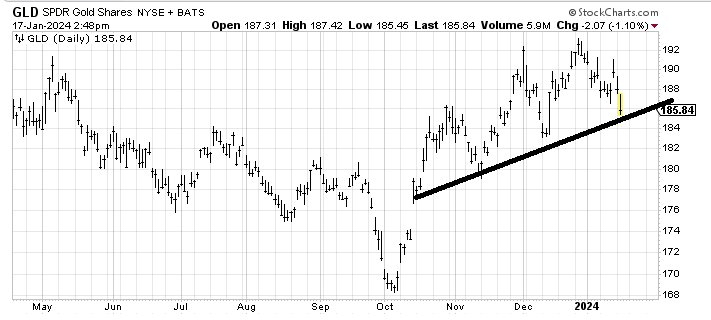
Gold Not Shining: GLD is at least making a higher low but that’s the best I can say about it. It is oversold (or close to it) so a bounce from $184-$185 is likely but I’d be a seller on a rally to around $188.
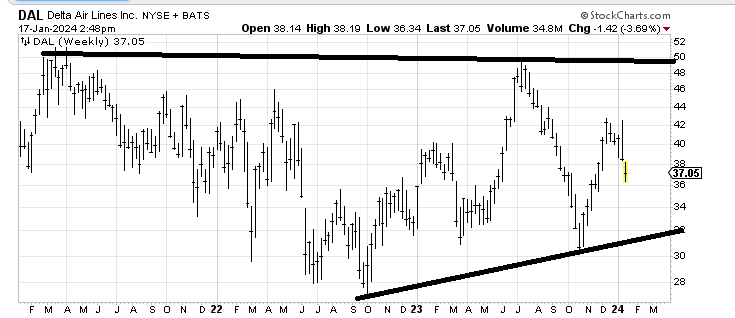
Delta Stuck: Yesterday I was asked about American Air AAL and the chart of Delta DAL so I thought we’d look at the three year weekly chart to see if there is anything there. All I can say is I see a giant trading range. Unless the economy collapses or oil surges over $100 I would expect that lower line ($32-ish) will hold on a move down there. It just looks like a giant trading range to me.
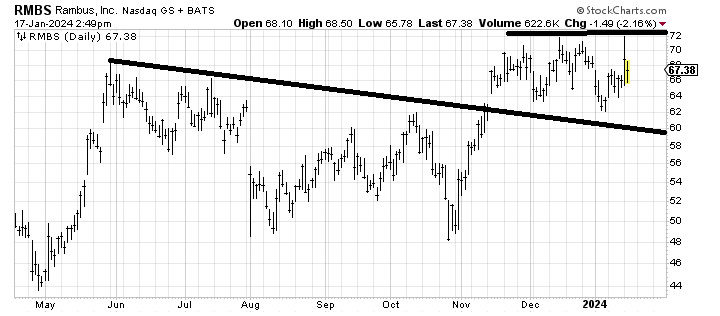
Rambus Resistance: Rambus RMBS looks to me as if it is enjoying a giant sideways move. Let’s call it $62-$72. That spike at $72 is going to be resistance in the near term.
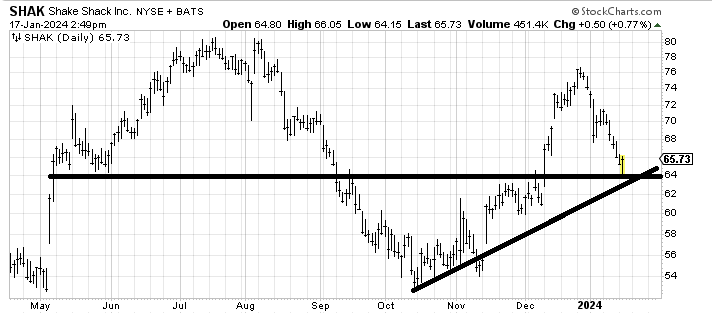
Selling SHAK: Shake Shack SHAK is bouncing off support. If it can get to $68-$70 I’d be a seller.