The Chart to Watch Right Now — And a Few Others That Help Tell the Story
Are we oversold? Are we due for a bounce? What's with the Russell's five-day losing streak? Let's answer those questions and a whole lot more.
You've reached your free article limit
You've read 0 of 1 free Pro articles.
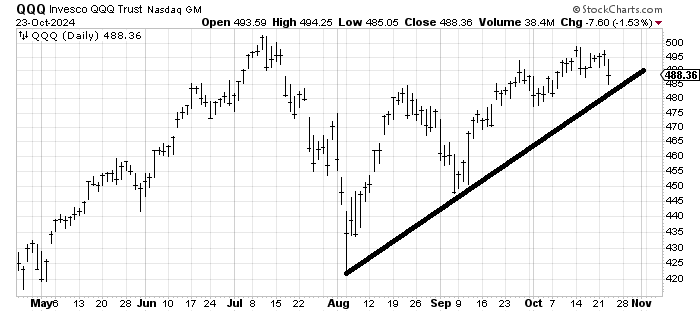
Would you be surprised to know that the QQQs closed on Wednesday at $488, which is the same place they closed on the last day of September? Yep, the QQQs are flat on the month.
And what if I told you that on July 2 the QQQs closed at $490, which would mean they are pretty much flat for nearly four months now. Yet the non-stop fussing over the handful of stocks that move the QQQs would make you believe there are no other stocks in the world.
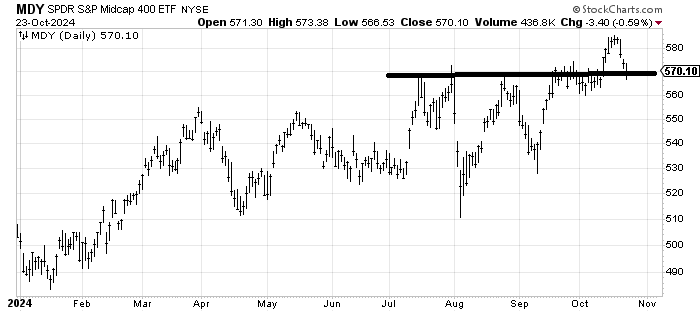
But I believe the chart to watch is the mid-caps, the SPDR Midcap 400 ETF MDY. They broke out in October and have come right back down. Was the breakout a false one or a real one? Take a glance at the breakout in July that turned out to be a fakeout.
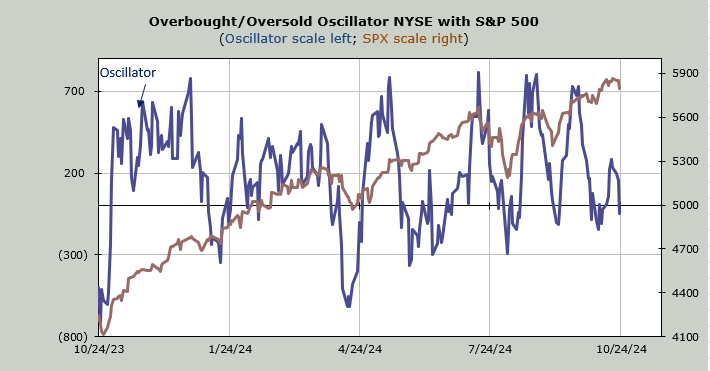
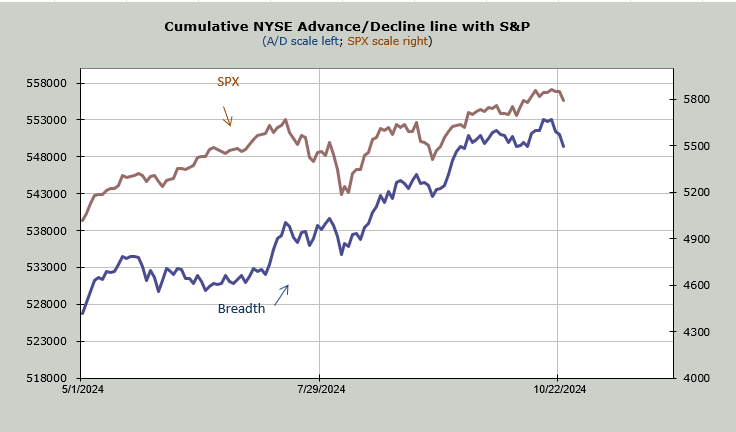
Once again I would like you to look at the chart of breadth on the NYSE (blue line). It had been lagging and then the market got short-term oversold and we had that catch-up rally where breadth made a new high. But now it has come right back down. Notice that it came back down to where it was just before that rally started two weeks ago. Yet the S&P 500 (brown line) is still not down there.
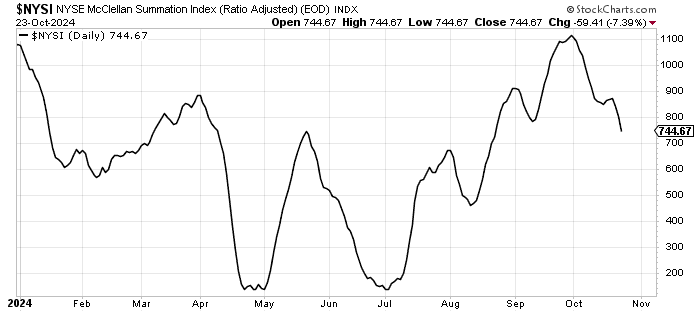
This matters because the McClellan Summation Index, a smoother version of breadth, has been heading down since the calendar turned to October. In fact, it is now lower than it was in early September. I use this indicator to tell me what the direction of the majority of stocks is, and for the last three weeks it has been down.
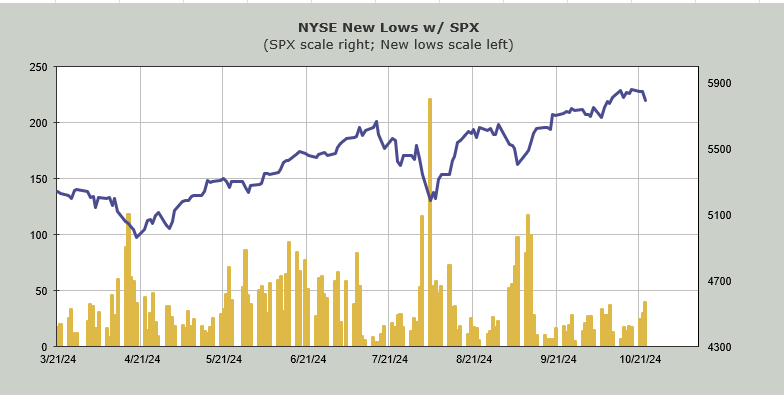
The number of stocks making new lows expanded just a bit on Wednesday. There are now more new lows than there were at that late September low. I always ask myself, if the S&P comes down to that level again, do I think there will be more or less new lows? The answer right now is more since we are already there.
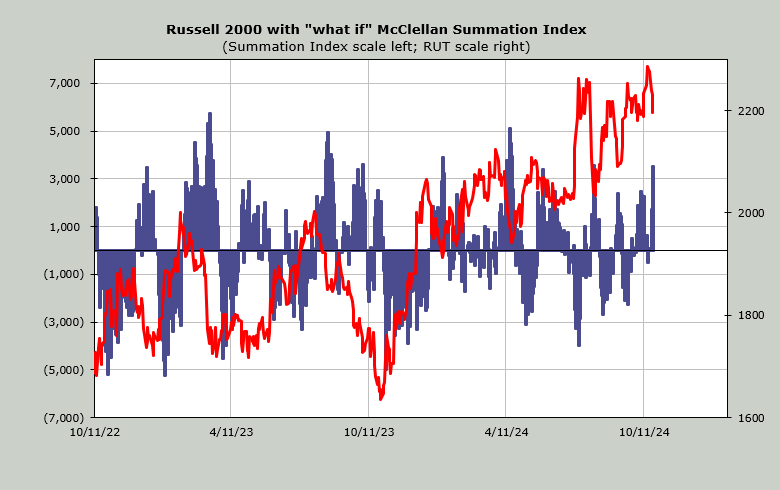
However, the Russell 2000 has been red for five straight days now. It hasn’t done that since the April decline (which lasted a few weeks). The last time it went to more than five consecutive days was the first week of 2024. It is very close to its 50-day moving average line as well. That alone should speak of a bounce.
But the McClellan Summation Index now needs a net differential of +3,000 advancers minus decliners on the NYSE to halt the decline. The last time it needed that much was in the midst of that April decline. We bounced for a day before resuming the downside. Thus a bounce would not surprise me.
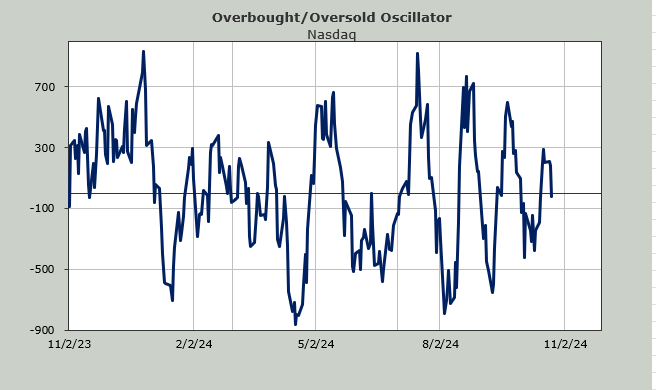
Still, when I look at my other short-term measures of momentum (overbought and oversold) there is not a lot to hang our hats on. Heck, the Nasdaq had its first day of negative volume (up minus down) in nearly two weeks so that doesn’t scream oversold yet.
We’ll get back to an oversold condition — we always do. Right now it just feels like a bounce not an oversold condition. But we’re moving in the right direction.