Stocks Rallied but the Indicators Inched Lower
It's all about the math. Let's take a look at the indicators to see why they didn't follow stocks.
You've reached your free article limit
You've read 0 of 1 free Pro articles.
But did the rally on Monday change anything? And by anything I mean any of the indicators. The answer is not really.
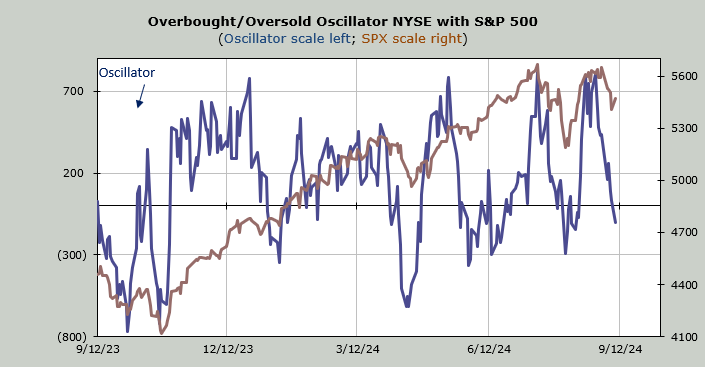
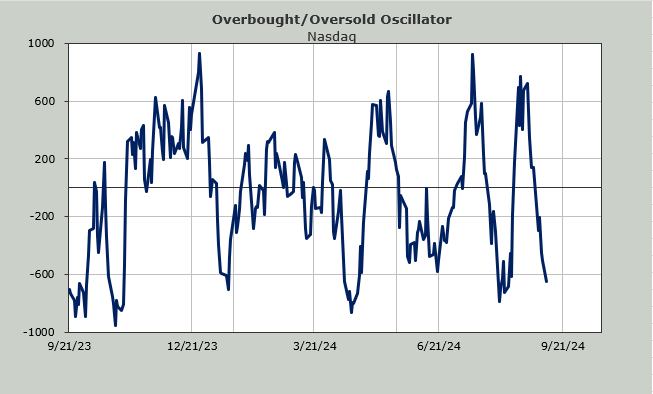
The first thing you will notice is that the Overbought/Oversold Oscillator went down. Yes down. You see, ten trading days ago net breadth on the NYSE was +2200 and Monday net breadth was +870. That means when we replace +2200 with +870 it goes down not up.
But notice that the NYSE is now under the zero line, something it hadn’t done before. Nasdaq’s has been under the zero line for several days now. But at least they are getting closer to a short-term oversold condition.
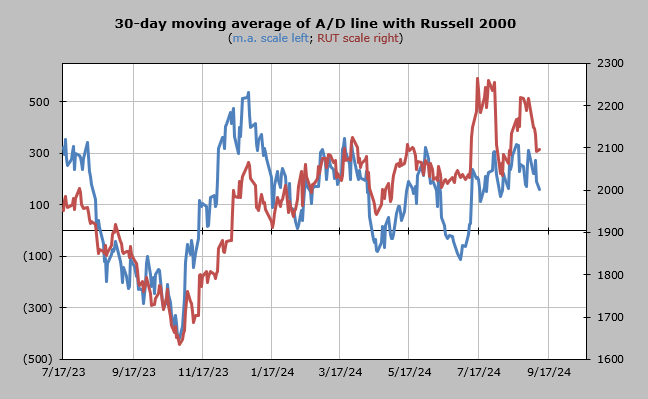
The more intermediate-term 30-day moving average is not oversold, although it too inched lower. The math behind this indicator says it should get a lift for a few days next week and then it faces a long string of positive numbers to drop. Remember, to get this to a good oversold condition we need to see a long string of negative breadth days. Without that this will not reach an oversold condition.
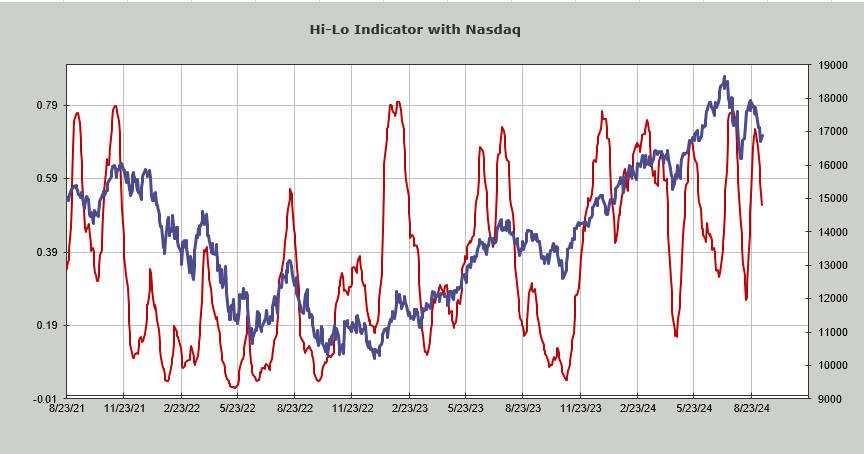
The Hi-Lo Indicator did move though. It is now down to .52. Much of that is the math. You see, ten trading days ago Nasdaq’s new highs were 303. Monday’s rally had them at 92. Ten days ago Nasdaq’s new lows were 57. Monday they chimed in at 182. It’s numbers like that that take the indicator down.
If you want to keep track at home, Tuesday, the new highs from ten days ago were 251, and new lows were 51. Anything fewer than 251 for new highs (likely) and anything more for new lows than 51 (also likely) should push this indicator lower.
I don’t believe it will be oversold enough to make a fuss, but it should bring it down into the 40s (under .20 is oversold)
The best news of the day came from the put/call ratio. Recall last week we couldn’t manage a reading over 1.0 until Friday. Well folks were having none of it on Monday as they kept this ratio up over 1.0 for the second day with a reading of 1.11.
This means the ten-day moving average of the put/call ratio is now at .94. A reading over 1.0 is when I believe folks have started to get concerned.
Finally, the ISE call/put ratio was 1.14. I like to see this under one. But this is the lowest reading we’ve seen since August 9th, so at least we’re finally seeing the small options players trafficking in puts. Friday this was 1.21. Call this a minor change.
