Speculative Juices Have Begun to Flow
While we're not yet at frothy levels, speculators have shown up to trade some smaller names.
You've reached your free article limit
You've read 0 of 1 free Pro articles.
Let’s begin with volume. The NYSE’s volume has been relatively stable, clocking in at approximately 3.2-3.4 billion shares each day. Long time readers will know that I do not consider low volume rallies to be bearish. They have been a hallmark of the market for years, decades even.
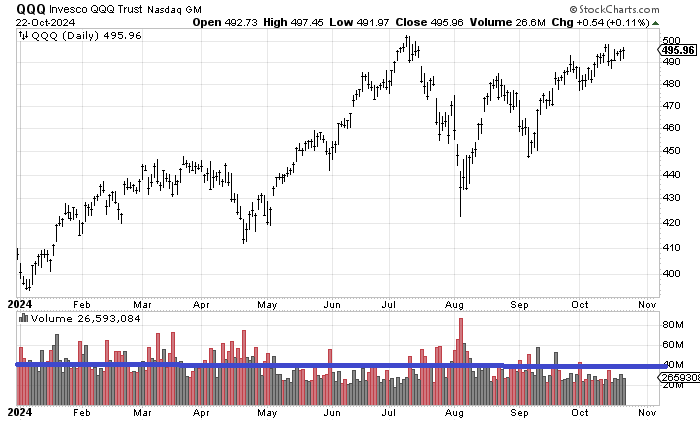
I often cite a high volume decline in the QQQs as a reason to look for a rally. Just a glance at the chart of the QQQs with volume will show you what I am talking about: that early August decline clocked in at 80 million shares, something I consider panicky.
But take a closer look now and you will see how low the volume in the QQQs has been for the last six weeks, and certainly the last week, where we have averaged 25 million shares each day.
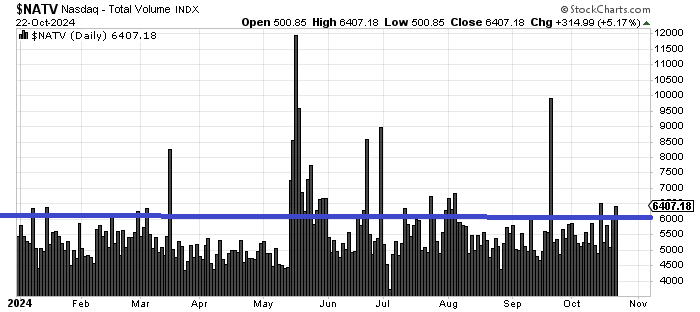
Now I would like you to look at the total volume on Nasdaq. It has been anything but tame these last two weeks. We’ve had three days with total volume ticking near 6.5 billion shares. Usually, when that happens and the market is up, not down, I look for speculative stuff on the move.
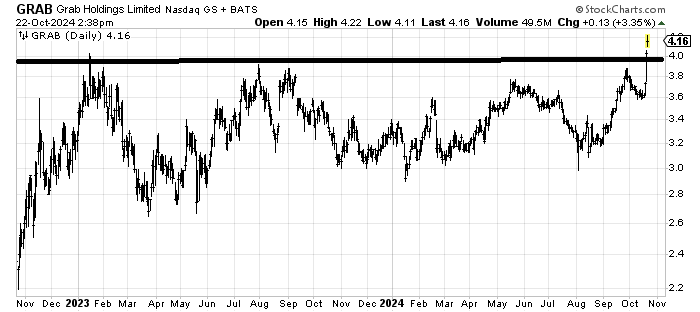
Sure enough, I took a look, and Tuesday saw Nvidia in the top slot on the active list, which makes sense. But the two stocks after NVDA that were most active on Nasdaq were two small names I have never heard of. One was a $4 Singaporean stock with a catchy ticker symbol: GRAB. It’s actually got a nice chart but that’s not what this discussion is about.
For ten of the last eleven days in the market—so two weeks—Nasdaq’s net volume (up minus down) has been positive, and not by a smidge. We’re not talking 80% of the volume on the upside, more like 55-65% but the total amount of volume is large. And that speaks of speculation running high.
We saw this during the SPAC craze, although this is nowhere near what that was. This is a much lower level but it’s still present. To me it’s another sign of folks leaning too bullish (but not quite extreme).
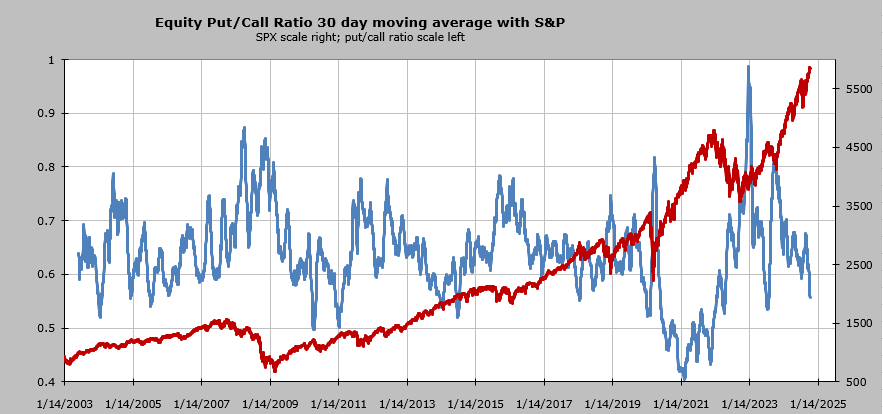
That brings me to an update on the 30-day moving average of the equity put/call ratio. It continues to inch lower. It is still about a point away from that mid-July 2023 level and a far cry from that major extreme in 2020-2021.
Even though the Russell 2000 has now clocked in four straight days of red the selling has been limited to individual stock names. For example Tuesday saw Nucor gap down as well as Kimberly Clark. But mostly stocks just continued shuffling around, more droopy than anything else.
The number of stocks making new highs has tailed off significantly but the new lows have only increased a small amount thus far. So I would say the speculative juices are flowing but they haven’t pushed into an extreme yet, they are simply knocking on the door.