Skies Clear Over Wall Street ... For Now
Breadth is improving and the technical data is neutral. But there's a catch.
You've reached your free article limit
You've read 0 of 1 free Pro articles.
Breadth is improving and the technical data is neutral as the skies clear over Wall Street. The only catch? Valuation remains extended.
All the major equity indexes closed higher Tuesday with positive New York Stock Exchange and Nasdaq internals, as trading volumes rose on both from the prior session. All closed near their session highs that resulted in several positive technical events. Cumulative market breadth also improved. The data dashboard is largely neutral, leaving only the extended forward valuation of the S&P very extended above ballpark fair value as an important concern.
In our opinion, despite the very strong futures this morning, we believe it would be unwise to chase prices at current levels. As has been the case for a while, we continue to suggest buying on weakness when stocks that meet our fundamental/technical requirements test their high-volume support levels.
The Charts and Technicals
All the index charts closed near their session highs that resulted in the Dow Jones Transports, the Mid-caps and the Russell 2000 closing above resistance with the Dow Jones industrials, Nasdaq 100 and Russell 2000 closing above their downtrend lines.
As such, the Dow, Nasdaq, Nasdaq 100, mid-caps and small-caps are now in neutral trends, with the Dow bullish and the S&P still bearish.
Cumulative market breadth also improved on the All Exchange and NYSE as their advance/decline lines shifted to neutral from bearish. The Nasdaq advance/decline line remains bearish.
Additionally, bullish stochastic crossovers were registered on the all major indexes.
In a word, the data is almost entirely neutral.
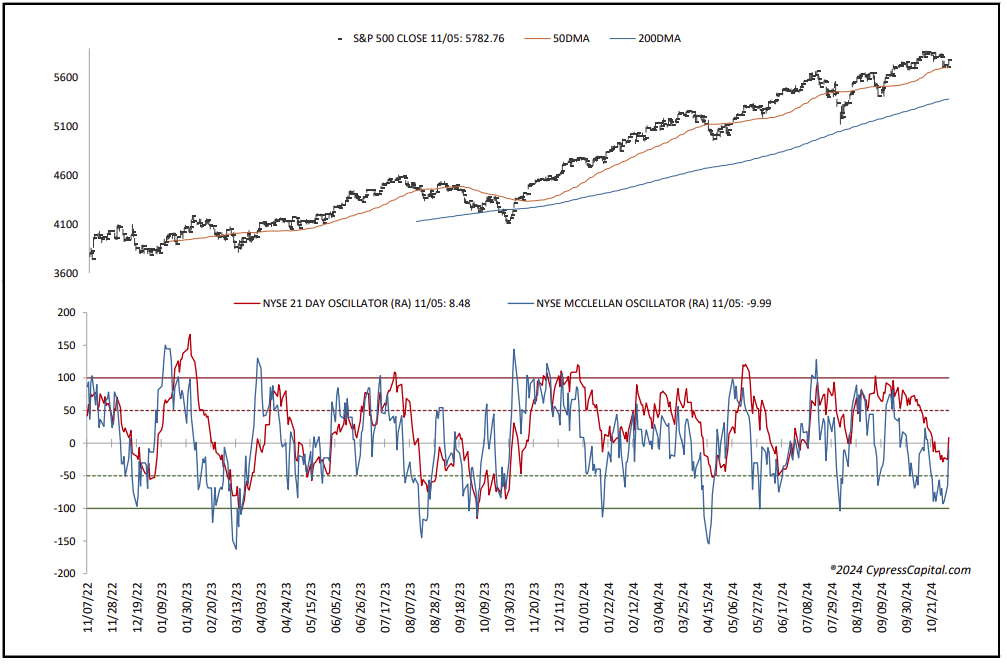
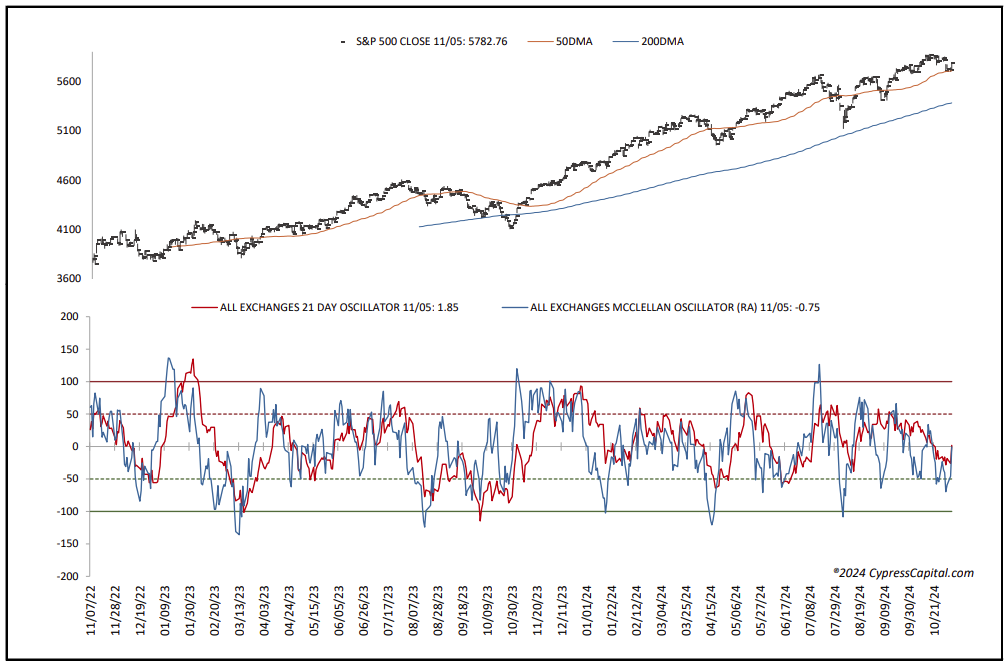
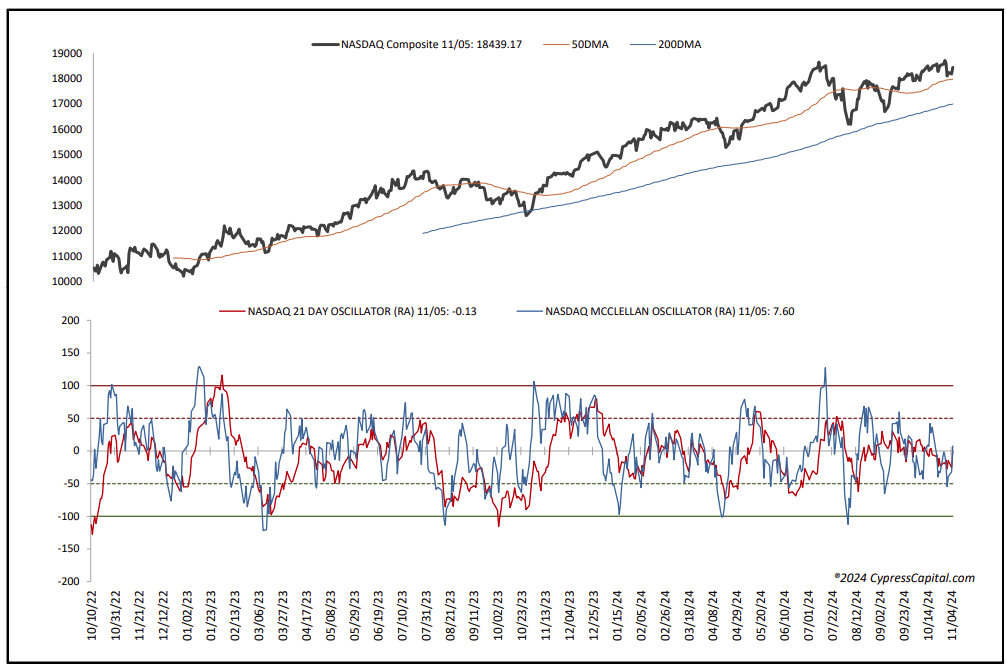
The one-day McClellan overbought/oversold oscillators are now neutral after flashing a bounce signal yesterday morning (All Exchange: -0.75; NYSE: -9.99; Nasdaq +7.6).
The Open Insider Buy/Sell Ratio slipped to 33.8, staying neutral.
As for the contrarian indicators, we have the following, mostly neutral readouts:
- The percentage of S&P issues trading above their 50-day moving averages rose to 55% staying neutral.
- The detrended Rydex Ratio dipped to 0.90, also staying neutral and less threatening.
- This week’s American Association of Individual Investors Bear/Bull Ratio is unchanged and neutral at 0.57.
- The Investors Intelligence Bear/Bull Ratio also was unchanged and neutral at 21.7/58.0.
Finally, valuation remains a concern. The 12-month consensus earnings estimate for the S&P from Bloomberg rose to $256.57, leaving its forward price-to-earnings of 22.5 remaining well above the “rule of 20” ballpark fair value at 15.7, as has been the case for the past several months. We believe this premium still presents some risk.
Its earnings yield is 4.44%.
The Buck and the Treasury
The 10-year Treasury yield slipped to 4.29% and is in an uptrend. Support is 4.10% with new resistance at 4.4%.
The U.S. Dollar, via the Dollar Index Bullish fund UUP, closed lower at $29.09 and is neutral. Support is $29.02 and resistance at $29.32.
Bottom Line
In conclusion, the weight of the evidence is benign, except for valuation that continues to be troubling. Yet, despite the generally blue skies, we would not chase price and would look at the opening as a potential selling opportunity in names approaching high volume resistance levels.