Rippin' Rally, S&P Buy Signal? Dreaming of a Soft Landing, What's Priced In?
Economic data have been better of late. However, calling it strong would be a stretch. Have you seen the latest 'fun index'? What does that say about quality of life in America?
You've reached your free article limit
You've read 0 of 1 free Pro articles.
A sixth consecutive "up" day, and a rather mighty one at that. All it took was a strong looking print for July Retail Sales, raised guidance from Walmart WMT and a couple of dovish words spoken by a Fed official. Suddenly, the talk and the feeling around the economy has turned from preparing for a possible, or even probable recession to once again expecting a soft-landing or "Goldilocks" scenario.
The economic data have been better of late. On that count there is no doubt. However, calling the recent data strong would certainly be a stretch of the truth.
On Thursday, traders chose to focus on an August Empire State Manufacturing Index that printed in a lesser state of decay than expected over an August Philadelphia Fed Manufacturing Index that hit the tape in a surprise state of decay when expansion had been projected. Guess what? Number of Employees and Average Workweek printed in a state of contraction in both of these regional surveys, while Prices Paid remained the "growthiest" subcomponent in both. Somehow that's positive?
But how about those July Retail Sales, Sarge? Those were strong, weren't they? More on that in a second. I'll counter your strong July Retail Sales with a very weak print for July Industrial Production. Not only did Industrial Production print at -0.6% m/m for July, but Capacity Utilization crossed the tape at 77.8%, down from 78.4% in June (a long way to fall in just one month). July was the weakest single month for Capacity Utilization in the U.S. since February 2022. Just Peachy.
Now, about those July Retail Sales. The headline print landed at +1.0% m/m, crushing expectations for growth of about 0.4%. Ex-autos, and the print remains stronger than expected at +0.4% versus +0.1%. Let's look into those sales, though, shall we?
Motor vehicles were obviously hot, as were electronics/appliances. Groceries too.
What was cold? Fun was ice cold. Frigid. The fun index is what I call the line item in the report labeled Sporting Goods, Hobbies, Music & Books. This single item best represents, in my opinion, what households are willing to spend on what they like, not what they need. This item printed at -0.7% m/m for July and at -6.8% year over year. On a year-over-year basis, the "fun index" is by far, the weakest single line item in this report. What does that say about quality of life in America?
We already knew that households were borrowing at record levels. We already suspected, but now we know for certain, that this borrowing has been done to maintain a basic standard of living, as household spending on one's own personal enjoyment is contracting quite rapidly.
Oh wait, Amazon AMZN had their big "Prime Day" event in July too, didn't they? Yet spending on fun still contracted mightily. To borrow a phrase from the brilliant Grant Williams... "Things that make you go Hmmm."
Marketplace
The Thursday trade was both broad and powerful. The S&P 500 rallied 1.61% for the session and ,as seen in the chart below, ripped past its 50-day simple moving average (SMA) like a hot knife through butter.
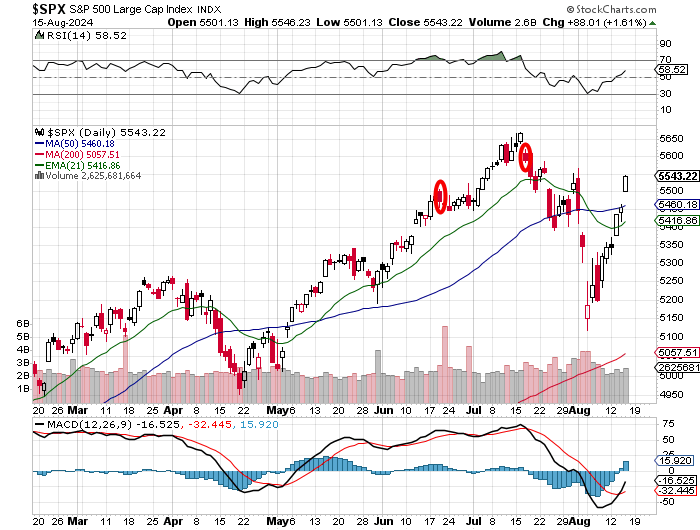
Readers will also notice that the daily Moving Average Convergence Divergence (MACD) of the S&P 500 has now experienced a bullish crossover of the 26-day exponential moving average (EMA) by the 12-day EMA with the histogram of the 9-day EMA in positive territory. That's usually a "buy" signal, kids.
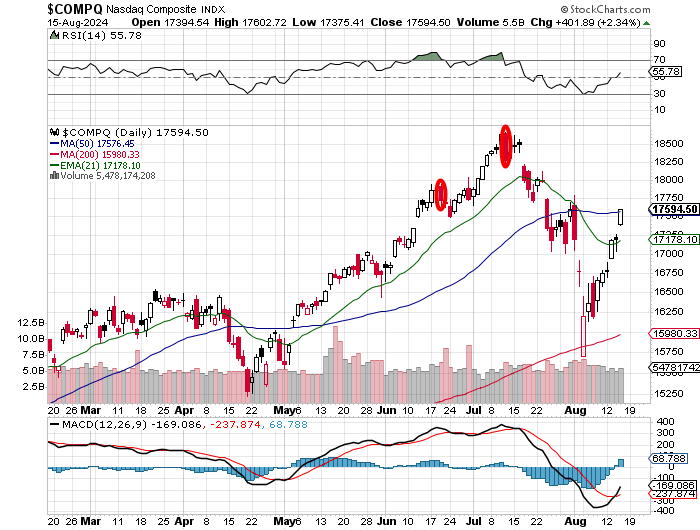
The Nasdaq Composite also enjoyed a sixth consecutive white or green candle day, gaining 2.34% for the regular session. Below, readers will see in the Nasdaq chart, the same MACD setup, as that index just barely kissed its 50-day SMA after testing its 200-day SMA less than two weeks ago.
The rally was broad as I mentioned above. Small-caps? The Russell 2000 gained 2.45%. The Dow Transports? Up 1.21%. The KBW Banks? Up 1.28%. How about the Philly Semiconductors? Up a mere 4.87%, led by Marvell Technology MRVL and On Semiconductor ON.
Market Breadth
Ten of the 11 S&P sector SPDR ETFs closed in the green. Nine did so legitimately, as the Utilities XLU closed very close to unchanged. Leadership was provided as you might expect by the Discretionaries XLY and Technology XLK, while only the REITs XLRE closed in the red. Defensively oriented stocks took the three bottom rungs on the daily performance tables.
Winners beat losers by about 7 to 2 at the NYSE and by roughly 5 to 2 at the Nasdaq. Advancing volume took a commanding 85% share of composite NYSE-listed trade and a 75.6% share of composite Nasdaq-listed trade. Most importantly, aggregate trading volume was 10.1% higher on a day-over-day basis across NYSE listings, up 9.9% across Nasdaq listings and up 10.2% across the membership of the S&P 500.
What this means simply is that the professional money that really had their faces ripped off a week prior to this past Monday, have been adding that risk on piecemeal all week and finally capitulated on Thursday. With portfolio managers having been taken literally to school over the past two weeks by traders, both professional and retail, could markets finally post a "down" day? If those managers are finally caught up? Yes.
What Exactly Is Being Priced In?
I mean, this is one dramatic shift in sentiment at the money management level in just two weeks' time. St. Louis Fed President Alberto Musalem did say on Thursday, "From my perspective, the risk to both sides of the mandate seem more balanced. Accordingly, the time may be nearing when an adjustment to moderately restrictive policy may be appropriate as we approach future meetings."
During Walmart's call on Thursday morning, CFO John Rainey said, "In this environment, it’s responsible or prudent to be a little bit guarded with the outlook, but we’re not projecting a recession." However, Rainey also said, "We're also seeing higher engagement across income cohorts, with upper income households continuing to account for the majority of gains, even while we grow sales and share among middle- and lower-income households." That would imply a tougher economic environment.
Rainey added: "We're seeing private brand penetration continue to increase, and we're highly encouraged by customer uptake of our new food brand, Better Goods, and the early excitement surrounding the relaunch of our young adult fashion brand, No Boundaries." This, too, suggests a more basic existence for American households.
Have investors and managers suddenly decided or have been somehow informed that a global, coordinated central bank easing cycle has already started, and the U.S. is just now joining something that has already been underway, which will of course add to the broadness and depth of such a change in trajectory? The Bank of Japan will do what they have to do. With that economy actually showing some growth, they may very well choose to continue their fight against inflation. That said, almost every other major central bank, and I don't mean just those representing reserve currencies, I mean most of the top 20 or 30 central banks, appear to be working together. Stocks? Yes. Gold? Oh, I certainly think so.
Economics (All Times Eastern)
08:30 - Housing Starts (July): Expecting 1.346M, Last 1.353M SAAR.
08:30 - Building Permits (July): Expecting 1.435M, Last 1.454M SAAR.
10:00 - U of M Consumer Sentiment (Aug-adv): Expecting 66.7, Last 66.4.
10:00 - U of M Consumer One Year Inflation Expectations (Aug-adv): Last 2.9%.
10:00 - U of M Consumer Five Year Inflation Expectations (Aug-adv): Last 3.0%.
13:00 - Baker Hughes Total Rig Count (Weekly): Last 588.
13:00 - Baker Hughes Oil Rig Count (Weekly): Last 485.
The Fed (All Times Eastern)
13:25 - Speaker: Chicago Fed Pres. Austan Goolsbee.
Today's Earnings Highlights (Consensus EPS Expectations)
Before the Open: FLO (0.33)
At the time of publication, Guilfoyle was long WMT, AMZN and XLU.
