Price Really Does Change the Sentiment
Let's take a look at some key stock market groups and see what's changed with the indicators.
You've reached your free article limit
You've read 0 of 1 free Pro articles.
I want to begin with sentiment. You see, over the last two weeks, the number of folks I have had tell me ‘stocks don’t want to go down’ has increased. And, it’s true, that the S&P hasn’t wanted to go down. But let’s talk about stocks and groups.
Remember the Utes everyone loved at 1070? They barely get a mention now that they have fallen four percent. Same with REITs. And what has happened to all the small-cap fans?
We looked at IWM a week or so ago and I drew in that black line noting I thought it would bounce off 215. It has. It has also done so in a pathetic fashion. It’s as if it has no life. It’s still down on the week.
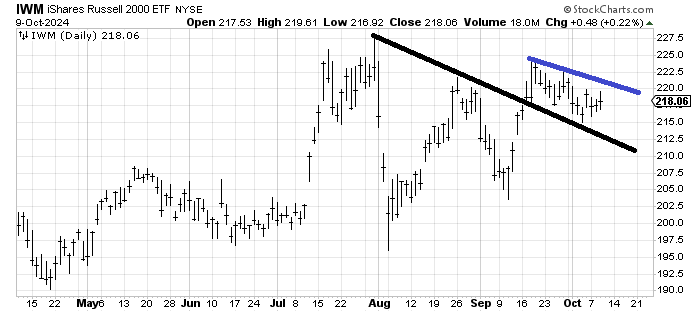
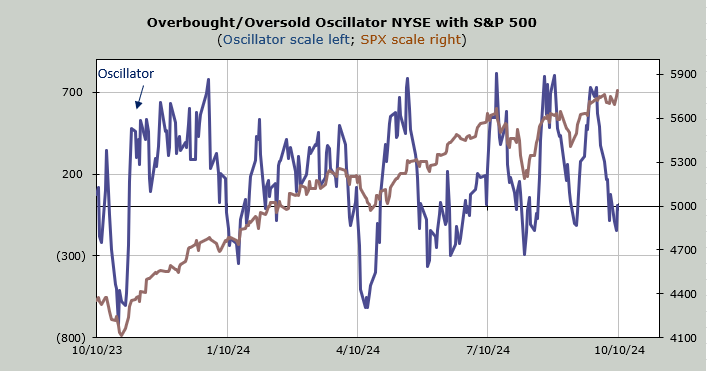
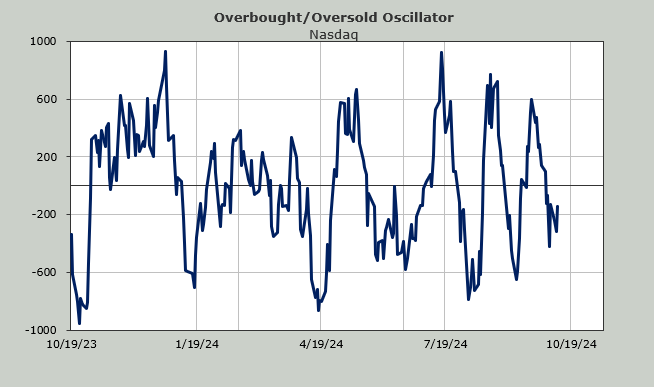
Recall that my indicators are based on breadth, namely the Overbought/Oversold Oscillator. That is still oversold. In fact, it has barely budged with the S&P rally this week because the rally has been so narrow. Can the IWM get going?
It’s no different than all the folks who saw the big head and shoulders top in the SOX and now that the SOX has rallied, they like the SOX. Price really does change the sentiment.
The ten-day moving average of the put/call ratio continues to bother me. The Investors Intelligence bulls are still at 53% and will likely push higher next week. I expect the AAII bulls to be higher when they are reported on Thursday.
The CNN Fear and Greed Index hasn’t crossed back over into Extreme Greed yet as it sits this side of it, in Greed.
Then there is the Daily Sentiment Index (DSI) which has now pushed to 81 for the S&P and 82 for Nasdaq. This is what happens when we don’t get a proper shake out and get the market back to a proper oversold condition. It gives sentiment a very short runway.
Everyone seems to have a target of 6000 for the S&P (or higher) and so try and imagine the S&P running another 200 points and the DSI still being down here instead of running to 90. Tough to imagine, isn’t it?
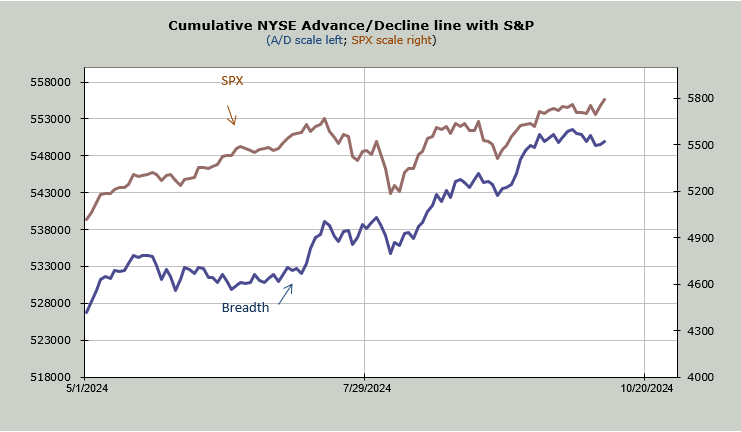
Now, let me get back to the breadth. For months, I have noted that breadth has been good. Even on down days, it’s mostly held in there, not giving much up. A few weeks ago, we saw breadth (blue line) make a higher high while the S&P barely eked out a higher high. In the last week or so, that has changed.
Notice the blue line has leaked lower while the brown line (S&P) has ticked up. That is what has changed. We haven’t seen that since the spring. Just look at that early August whack in the S&P that barely showed a plunge in breadth.
What you don’t want is the DSI getting high while breadth is crummy. That needs to change.