Post Plunge Playbook
The market will fool most of the people, most of the time. Let's look at human nature and the sentiment indicators, to see what's next.
You've reached your free article limit
You've read 0 of 1 free Pro articles.
Now that we got a rally let me reiterate the way I typically see the process playing out.
The market plunged. At first folks shrug and think, we’ve seen this before. Then we plunge a bit more and some of that complacency evaporates. Then we plunge a bit more and still more bullishness falls away.
Then we get a little oversold and folks start looking for an oversold rally (see my post earlier this week). But we don’t rally immediately, and we get comments like I discussed yesterday—oh no, it’s an oversold market, and we’re not rallying; that’s bearish!
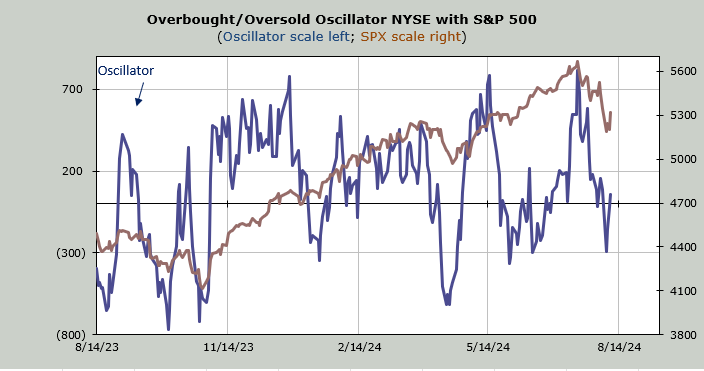
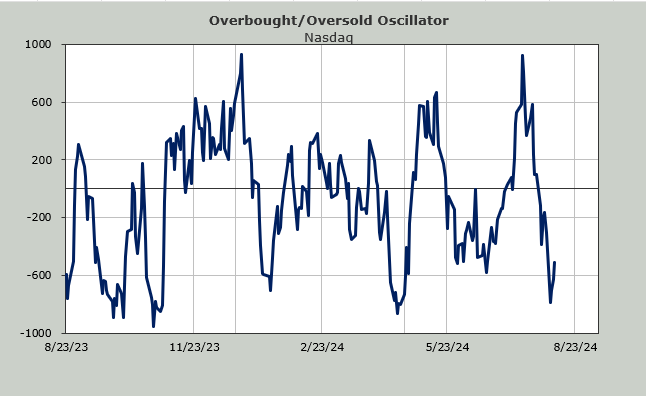
Then we rally and the folks who got bearish should slowly turn bullish again. I can already see it all around me, anecdotally. We finally rallied on Thursday, and now everyone is wondering if the low is in. Some folks who were screaming for an emergency rate cut on Monday have backed off of that too. I suspect if we rally some more, folks will soon forget they were ever bearish on Monday. That is typically when we see the market pull back again.
Sure, we finally rallied on Thursday but it’s not like any of the indexes cruised past Wednesday’s high. The whole week, since Monday has been like walking around in the dark as if your hands are out in front of you feeling around for something to hold on to. And maybe you even stub your toe while you’re fretting over your hands.
Breadth was good. Upside volume clocked in at 85% which is much better than what we saw during Tuesday’s rally. And the best news is that the Hi-Lo Indicator for Nasdaq is now at .40. We entered the week at .59. That’s a lot of progress in a week.
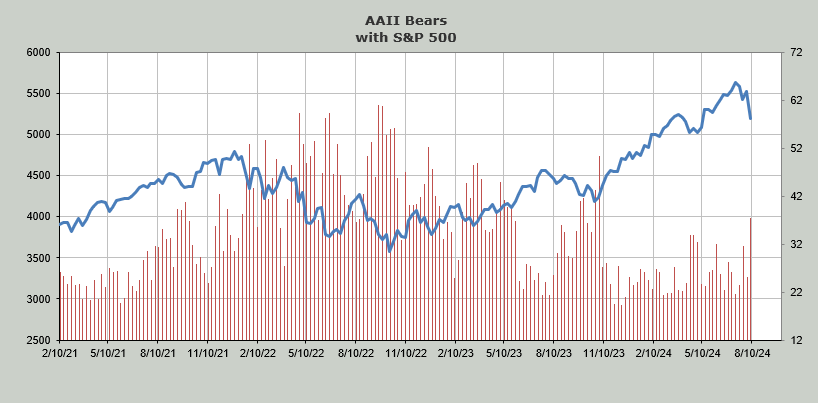
Then there is sentiment. In terms of the indicators we’ve got some movement. The American Association of Individual Investors (AAII) saw a small pull back in bulls but a huge jump in bears as they are now far more in number than they were in April.
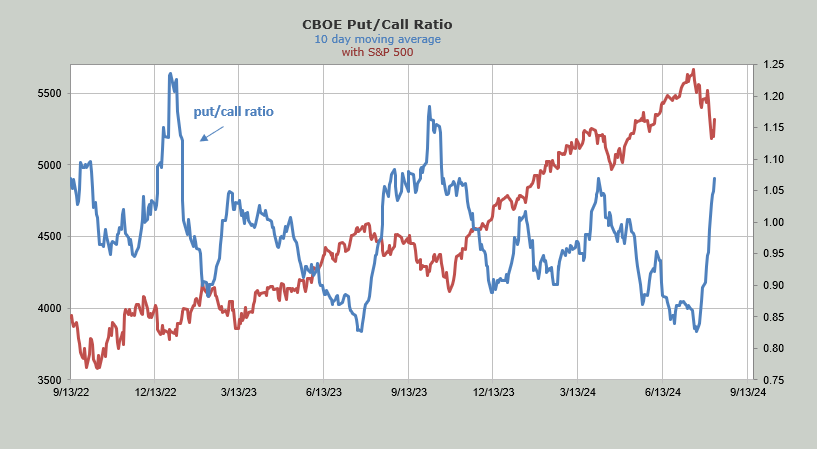
The put/call ratio did not sink on Thursday but notched up to 1.19. That means the ten day moving average is now closing in on the level it was in April.
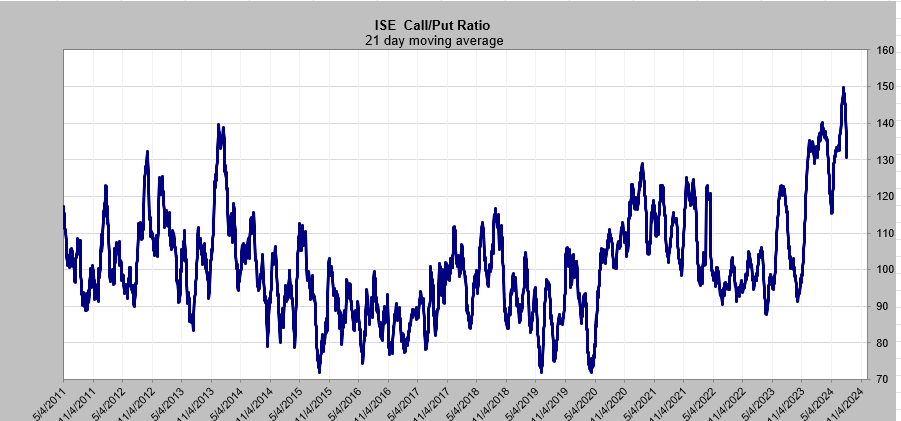
While the ISE call/put ratio did not stay under 1.0 it was low enough to take that 21 day moving average down to 1.3. That’s still nowhere near the April level, but at least you can now see the move on the long term chart.
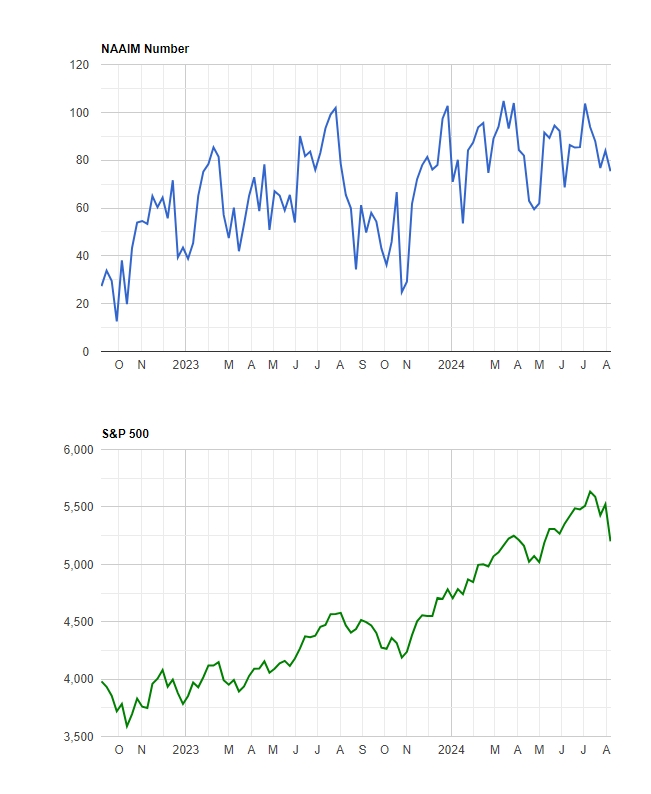
The sentiment indicator I find most curious is the National Association of Active Investment Managers (NAAIM). These folks usually panic from a two percent pullback in the market and now they sit with their exposure at 75. It was lower in May!
I still think we will come down after an oversold rally (that NAAIM number should be lower).