Overcrowded Trades, Extreme Correlations, High Leverage. What Could Go Wrong?
The most popular trades heading into year-end could eventually be among the most painful for those who are complacent.
You've reached your free article limit
You've read 0 of 1 free Pro articles.
Highly correlated markets can signify complacency, an environment of heavy algo trading influence, or both. As we approach the depths of the holiday season, trading volume is dwindling to what are usually annual lows.
Further, many pivotal futures contracts expire between Thanksgiving and Christmas, creating a bit of a pain-trade price squeeze as those under duress hold on until the last minute, hoping for relief. Both December currency and Treasury futures drop off the board this week.
Due to contract expiration and holiday trade, we often see inexplicable and generally unsustainable trend extensions. Yet, as liquidity returns after the new year, we can see those trends reverse.
A few markets we think could be candidates for the holiday price squeeze followed by dramatic reversals are currencies, Treasuries, and gold. Not coincidently, these markets have grown to be either obscenely correlated or unusually uncorrelated and are generally overcrowded.
U.S. Dollar: Overcrowded Long, Extreme Bullish Sentiment, Unsustainable Negative Correlation
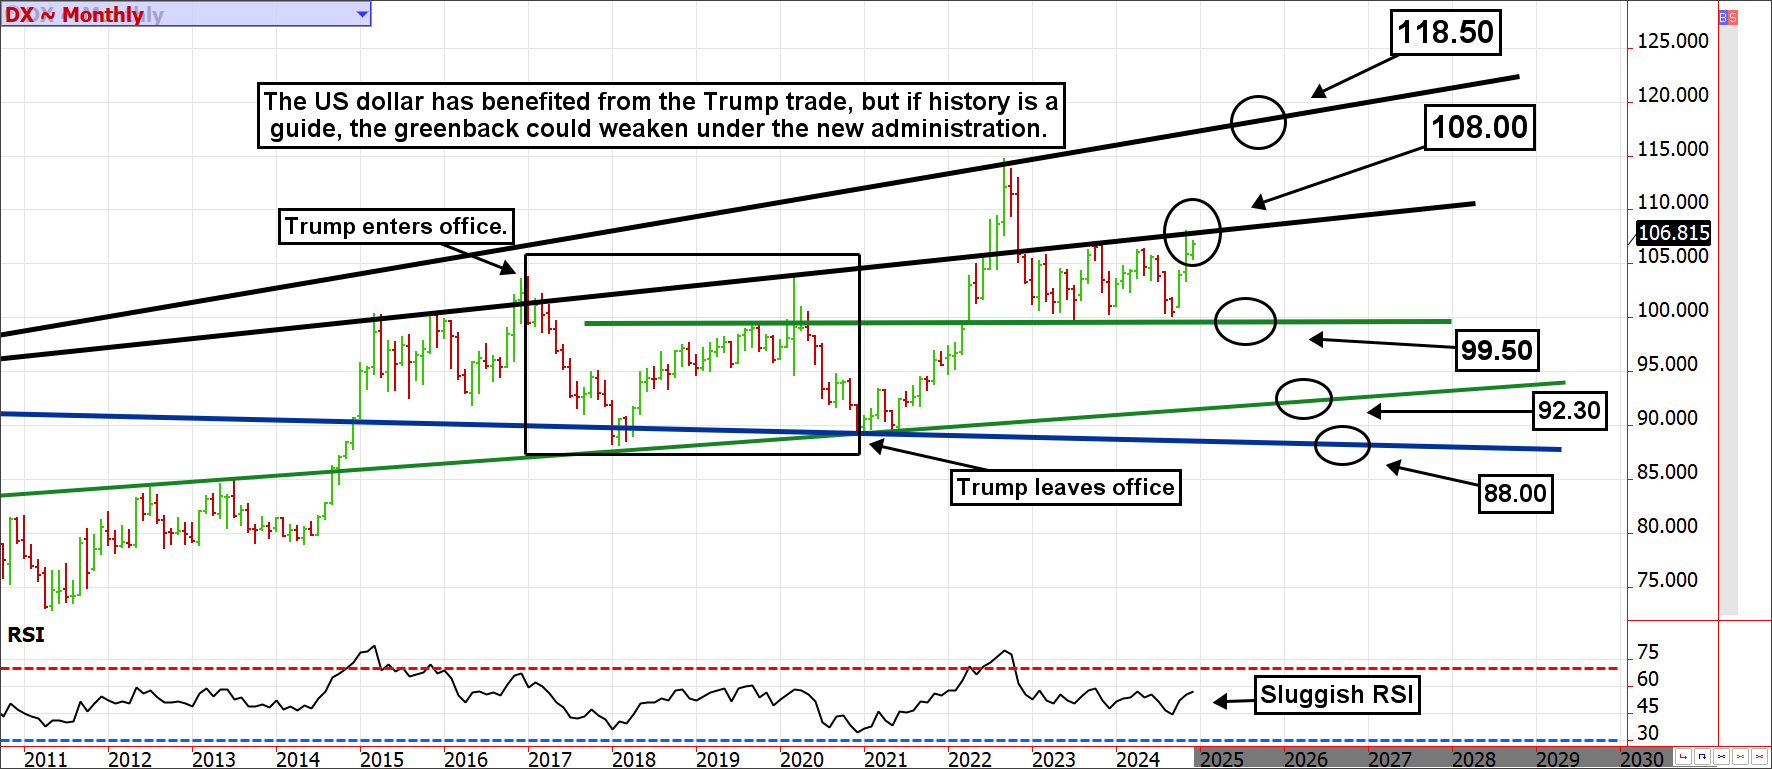
The greenback went parabolic for much of the fourth quarter of 2024. The U.S. dollar index futures contract traded on the ICE Exchange rallied from about 100.00 to 108.00 in a relatively short time.
The U.S. dollar deserved to rally; the U.S. economy is far and away surpassing most of its peers while interest rates in the U.S. remain elevated relative to other major currencies.
The rally continued on hopes of more prosperity due to business-friendly policies doled out by the next administration. However, the so-called Trump trade could already be priced in. Even more concerning to the dollar bulls is that the dollar weakened, not strengthened, during the last Trump administration.
Finally, algorithmic trades were carried away with long dollar and short 10-year note futures trades. These markets have settled in the opposite direction a whopping 92% of the time over the last 180 trading sessions. Similarly, the euro currency futures contract and the 10-year note have settled in the same direction 95% of the time.
Extreme correlations such as this are generally a sign of bandwagon trading that often overshoots fundamentals. If so, we could see a lower dollar and higher Treasuries in 2025.
The Consensus Bullish Sentiment Index, which polls industry insiders, suggests 74% are bullish on the dollar, and a mere 26% are bullish on the euro. This lopsided reading suggests that most market participants have already taken action.
Most buyers are probably in with the greenback approaching significant technical resistance near 108.00. This leaves the dollar vulnerable to a sharp reversal in early 2025. A sluggish RSI (Relative Strength Index) confirms that the index will likely struggle to hold above 108.00 resistance.
The trendline represented at 108.00 was only violated a few times in the last decade. Once, just after Trump was elected in 2016, before collapsing for much of 2017, the other was the massive explosion of inflation and flight-to-safety buying that took place after Russia invaded Ukraine in 2022.
We don’t expect a repeat of 2022, but we could very well be setting up for a repeat of what was seen in 2016/17. If we are right, look for the dollar index to make its way back into the low 90.0s. This would be enough to attract buyers into Treasuries.
Japanese Yen: Becoming Overcrowded Again, Extreme Correlation to 10-Year, Signs of Complacency
We have forgotten the currency that started the short-lived panic in late-summer trading. The Japanese yen has given back nearly all of its carry-trade-unwind gains and will likely continue to do so as we work through the holiday season.
Investors have been spoiled by the fruits of borrowing yen at low interest rates to buy riskier or higher-yielding dollar-denominated assets. This form of leverage can work as planned for years or even decades but can’t persist forever, and it has been known to end poorly.
The lower the yen descends, the more dangerous it becomes. A retest of the breakout trendline will support the currency near 0.6400 (this means it takes about 6.4 cents to purchase 10 yen), but a full retest of the downtrend line that dates back to 2004 is in play.
This would mean the yen could drop to about 0.6150; if so, when the market least expects it, the carry trade would be highly vulnerable to another round of unwinding. However, it might become a more permanent phenomenon if this happens again. If so, it would be a headwind to stocks as leverage and froth are backed out of the system, but it would be a tailwind for Treasuries.
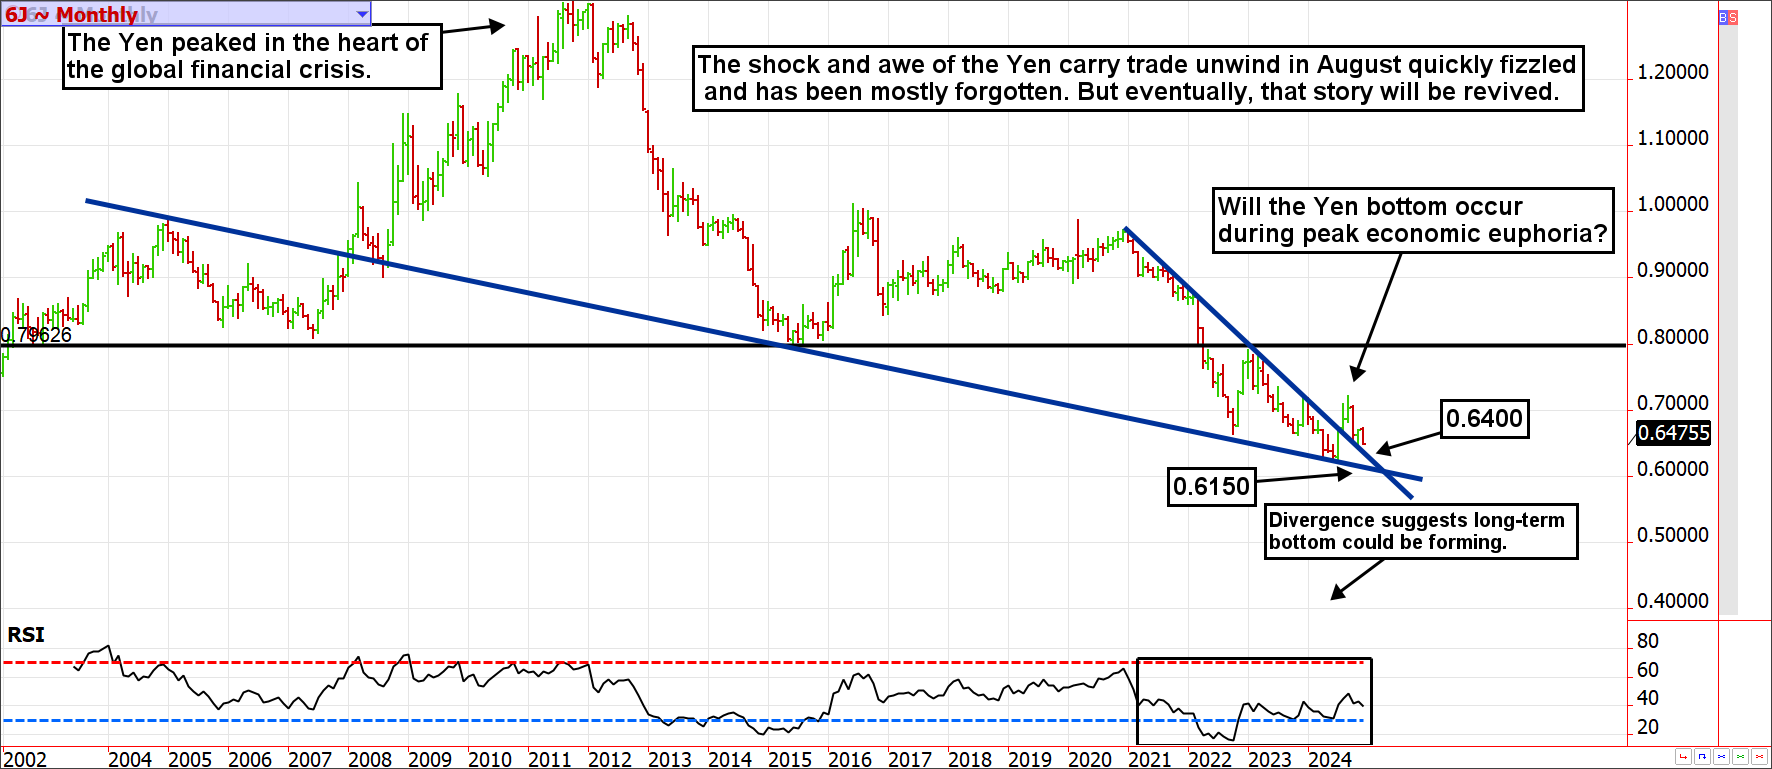
The Japanese yen peaked at the heart of the global financial crisis. The world was convinced that yen was a safe-haven asset. However, in 2024, a decade later, investors have found little reason to be long the yen. Perhaps peak economic and stock euphoria will mark the bottom of the yen in the same way the opposite environment led to the currency's top. In any case, the monthly chart depicts a divergence between the RSI and the price of the yen. As the yen has made lower lows, the RSI has not. These patterns can take several months to play out, but they are generally reliable. With this in mind, we suspect the yen is a much better buy than a sell despite how the masses are positioned.
You don’t have to be positioned in the yen for this to be on your radar; the yen and the 10-year note have traveled in the same direction 92% of the time over the last 180 trading days. Thus, strength in the yen will translate into firmer Treasuries and lower interest rates; it will also play a significant role in the potential for a weaker dollar.
Gold vs. 30-Year Bond Future: Lack of Correlation Is Odd and Likely Unsustainable, Overcrowded Trades
Thus far, we have pointed out the unusually strong relationships between the dollar and Treasuries (negative correlation) and the yen and Treasuries (positive correlation). Now, let’s focus on an area of the market where correlation is absent.
In a normally functioning market, gold and Treasuries compete for investment dollars. Both are considered risk-off or safety assets, although both have resembled the opposite in recent history. However, one alternative asset pays interest, while the other doesn’t. Accordingly, it is natural for low-priced Treasuries, or higher interest rates, to thwart the demand for gold. Similarly, high Treasuries or low interest rates make gold more attractive. The result is generally a positive correlation between the assets. When the correlation breaks, they tend to return to each other in a mean reversion event.
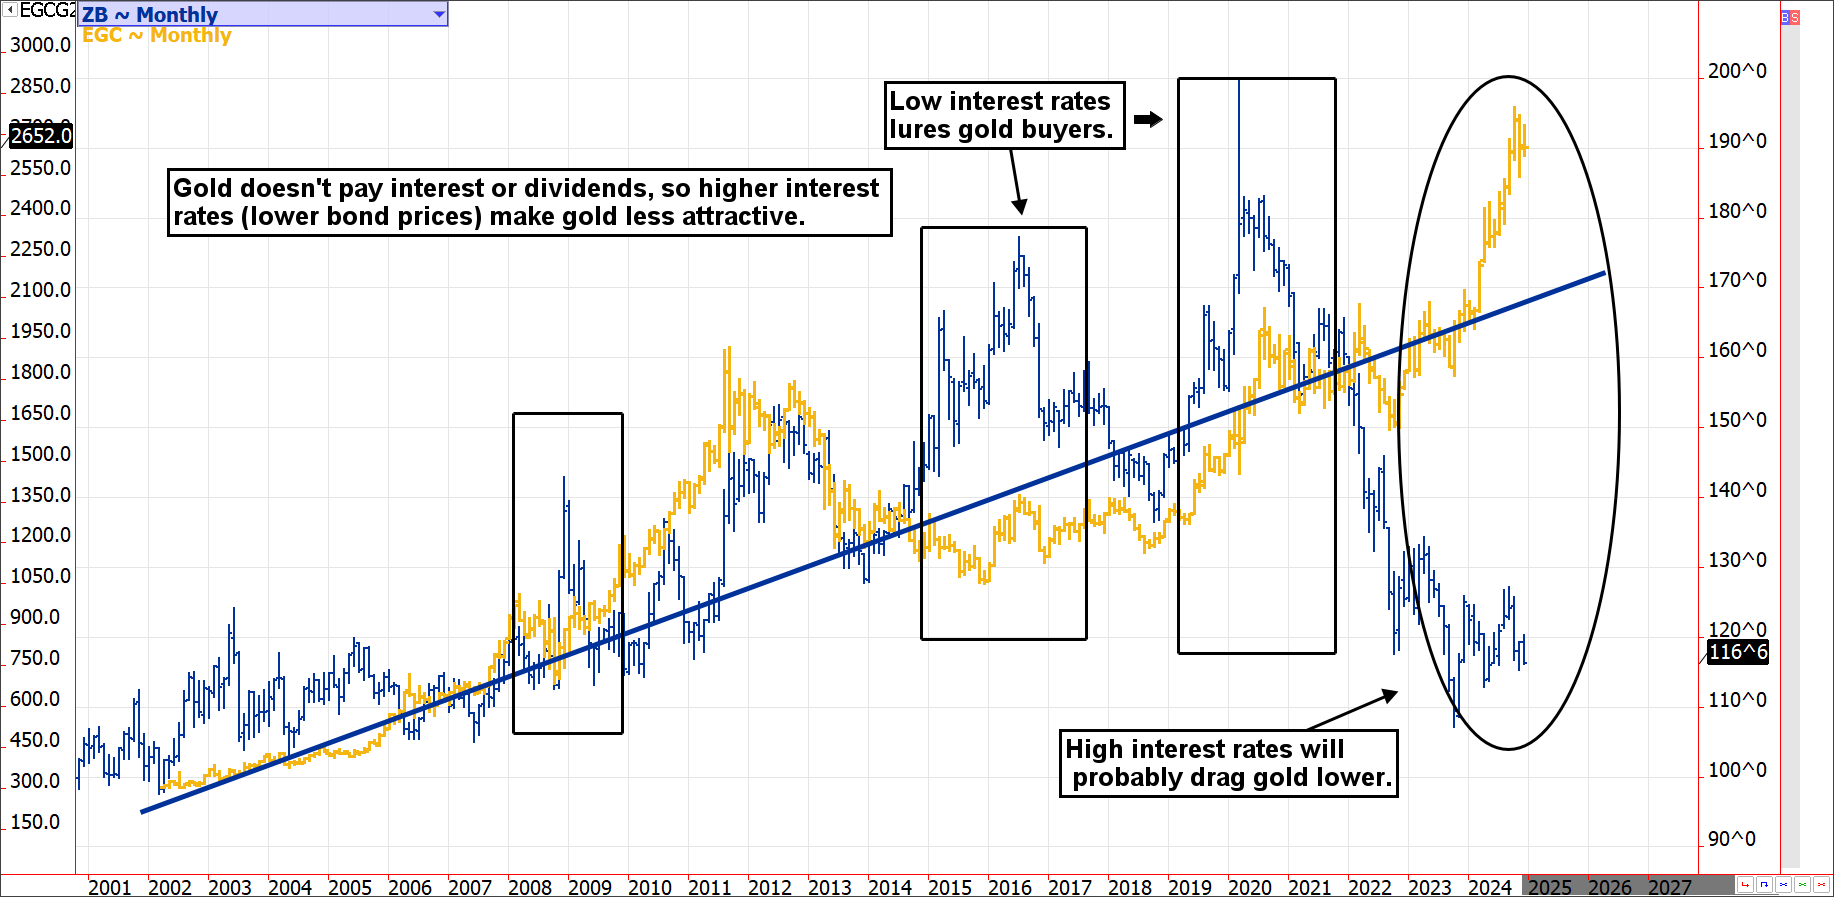
In 2015/2016, interest rates were relatively low, which enticed savers to put risk-off savings into gold. We have to wonder if investors will eventually find value in high Treasury yields compared to lofty gold pricing. We believe that for this reason and many others, gold is in the process of putting in a significant top, and Treasuries, although they are taking the scenic route, are likely putting in a significant bottom.
Treasuries: Overcrowded Short Position and Unsustainably Correlated With Currencies
This has been the worst multi-year stretch for Treasury holders in history. Unfortunately, there is a window of opportunity for the bears to continue their thrashing of conservative savers.
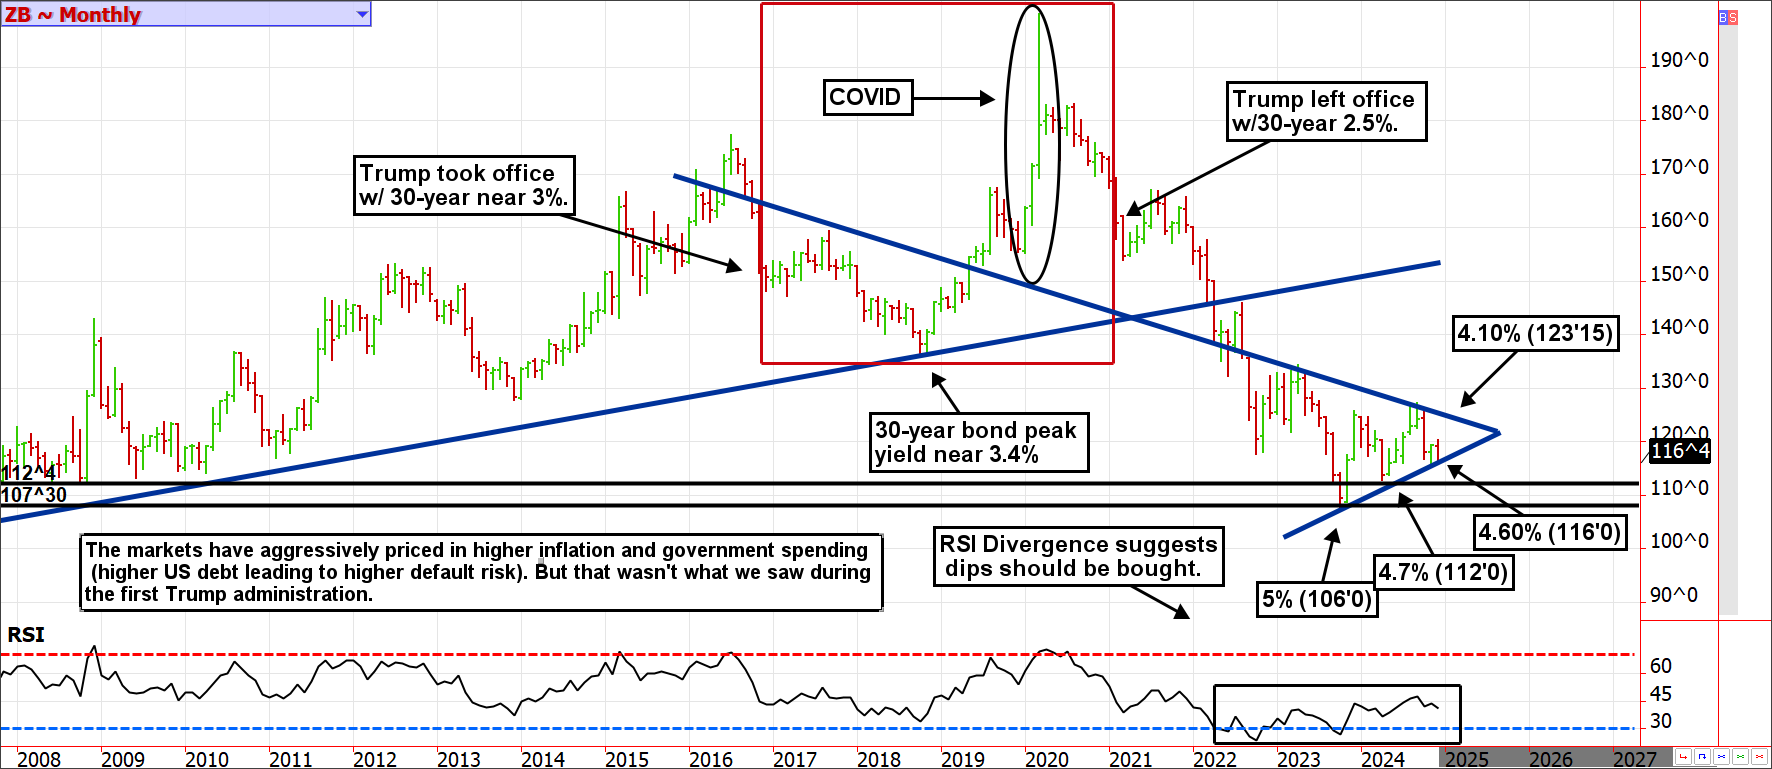
As mentioned, holiday trends sometimes become entrenched longer and further than they otherwise would. Nevertheless, the 30-year bond futures continue to hold their uptrend line near 116’0 (a yield of about 4.6%), while RSI divergence suggests the odds favor dip buyers and not vice versa.
What's more, Treasury sentiment remains overly bearish while speculators continue to hold one of the largest net short positions of all time in 10-year note futures. Specifically, large speculators are net short just under 900,000 contracts. This group was short over a million contracts in September, so they have merely trimmed their position. The bulk of the bearish trade still lingers and threatens market stability if the bears all decide to head for the exits simultaneously.
Those positioned on the short side of the market due to the premise of more government spending, inflation, and economic growth under the next administration might be right, but that wasn’t what we saw on the last go around. The last time Trump took office, rates on the 30-year bond were over a percent and a half lower than they are now, and they peaked just four-tenths of a percent higher. This, along with RSI divergence and the potential of a lower dollar in 2025, should keep a floor under Treasuries.
At some point, investors might be given a reason to seek safety from risk assets; if they do, the most obvious beneficiary will be U.S. Treasuries, which yield more for less risk than similar income-producing assets. The bulls need to break above 123’15 (fall below a yield of 4.10%) to confirm a trend change. In the meantime, we expect 116’0 or a yield of 4.6% to hold but 112’0 (4.7%) is somewhat probable as we work through holiday trading.
Bottom Line
The most popular trades heading into year-end could eventually be among the most painful for those who are complacent. The obvious fundamental stories going into the end of one year rarely hold up throughout the next.
Stay on your toes!