Messy Market, Change in Trend, Weak Economy, GDP Revision
It's been a tough week. It's about to get tougher. Maybe.
You've reached your free article limit
You've read 0 of 1 free Pro articles.
US equities more or less closed lower on Thursday. Not all equities mind you, but certainly the big, hairy ones that bear more weight upon the major indexes than they probably should, did hit a tripwire.
The Nasdaq Composite gave back 1.08% on Thursday as the S&P 500 surrendered 0.6%. Both were weighed down by technology stocks from the software industry in particular as UiPath PATH, Salesforce CRM, and ServiceNow NOW were slapped around for losses of 34.01%, 19.87%, and 12%, respectively.
Thankfully, I stepped out of the way in Salesforce and avoided this mess. Not so gracefully, I took the selloff in ServiceNow, which was part of the pin action associated with the Salesforce beatdown on the chin and added to that long position after last night's close.
Very interestingly, on the same day that the BEA revised its estimate for Q1 GDP was lower, the parts of the market more reliant upon economic growth did well. The Dow Transports gained 1.31% on the session after having traded at its lowest level since November on Wednesday. Smaller caps enjoyed a bit of strength for the day on Thursday as well. The Russell 2000 gained an even 1%, while the S&P midcap 400 took back 1.03%. So, do we have, or not have, a confirmation of last week's change in trend? More on that in a minute.
Breadth
Simply put, breadth on Thursday was minty fresh. Setting up for a month-end mark-up? This is Wall Street? Of course, there is a chance that such an event could be in the cards. If there is a mark-up, portfolio managers will not likely get a ton of help from pension plans with mandates.
The S&P 500 is still up 3.97% for May, while the Nasdaq Composite is up 6.89%. There will also not be much of a mandated move in Treasuries, as I saw the US Ten Year Note paying a rough 4.57% this morning. That yield was down to 4.34% mid-month but started the month at 4.58%.
For the day on Thursday, which is contrary to headline-level equity index performance, winners beat losers across the NYSE by an odd-looking 13 to 4 margin and at the Nasdaq by about 3 to 2. Advancing volume took a 66.4% share of composite NYSE-listed trade and a 65.9% share of composite Nasdaq-listed trade as aggregate trade increased on a day over day basis across the listings of both exchanges. Hmm. That makes analyzing the day's results a little messy.
So will this... nine of the eleven S&P sector SPDR ETFs closed out the session in the green, led high by the REITs XLRE and the Utilities XLU. We get that. Defensive sectors led, not because they are defensive in nature, but because yields across the US Treasury curve were lower in response to the weak GDP print and these two sectors are interest rate sensitive more than they are defensive.
Growth sectors quite obviously came in the tenth and eleventh places for the day as that was where the pain was. Technology XLK gave up 2.31% as the Dow Jones US Software Index was beaten for a loss of 4.8% and the Philadelphia Semiconductor Index gave back 0.88%.
Confirmation?
It's been a tough week. It's about to get tougher. Maybe. With GDP behind us, and a flurry of wildly erratic earnings releases in the books, markets will look to PCE inflation for April this morning as a potential catalyst. The truth is that given its late release date (about a month after the reporting period ends), PCE rarely surprises. This morning, we will look for month over month inflation of 0.3% at both the headline and the core, and year over year inflation of 2.7% at the headline and 2.8% at the headline.
Before we can look forward though, we must look backwards. Last Thursday, a week prior to yesterday, both of our major indexes experienced a potential Day One of a change in trend. Let's look at the S&P 500...
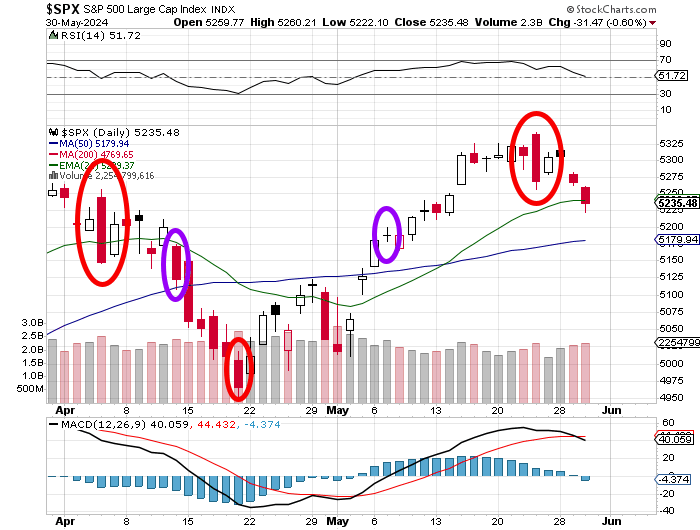
Readers can see the change at the top last Thursday. Readers can see in the daily MACD (moving average convergence divergence) the crossing of the 12-day EMA (exponential moving average) below the 26-day EMA, as the histogram of the nine-day EMA dropped below zero. This is bearish.
Readers can also see that trading volume increased over the past two days, which were red candle days. By the book, one can say that the S&P 500 has confirmed a downward change in trend. My only cause for hesitancy here is that we know breadth was positive yesterday despite the red candle at the headline level. For what it's worth though, we have confirmation. I would rather see a stronger signal, but it is what it is.
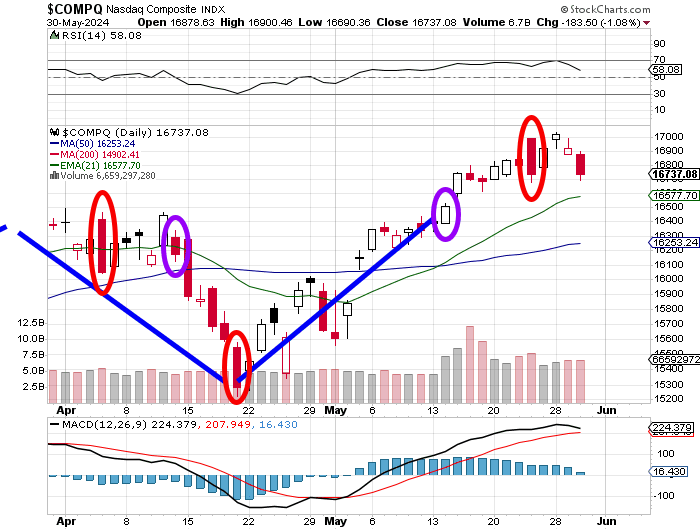
Confirming the Nasdaq Composite is more problematic for me at this time. We do have the red candles over the past two days on increased traffic. That much is true. We have issues though. On Tuesday, this index created a high above our "day one"... does that reset the clock? Yes, it could.
Additionally, here... look at the daily MACD. The cross-under of the 26-day EMA by the 12-day EMA just has not yet happened. The histogram of the nine-day EMA remains above zero as well. I cannot say that we have experienced a confirmation of a change in trend for the Nasdaq Composite.
The trend may have still changed. The S&P 500 tells us this. The S&P 500 may trade lower without the Nasdaq Composite moving in lockstep. We have seen that before. Then again, for this index, day one may have been yesterday. Remember, we need at least a day in between day one and confirmation. Hence, day one cannot be Wednesday.
Perhaps...
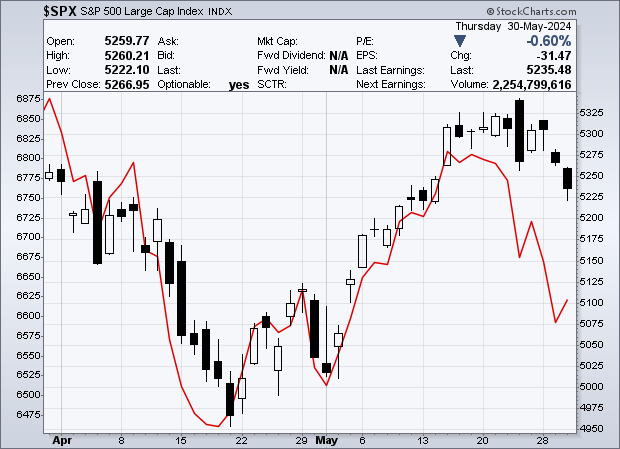
...The confirmed downtrend for the S&P 500 was already here. Below, we see the divergence between the S&P 500 and the equal-weighted S&P 500 over the same time frame as above. The equal-weighted S&P 500 starts out this two-month period above the S&P 500 and now stands well below. Just take a look at this:
Slowing Down
On Thursday morning, the Bureau of Economic Analysis revised the agency's estimate for Q1 GDP from growth of 1.6% to 1.3% (q/q, SAAR), while also revising the estimate for personal consumption expenditures down to 2.0% from 2.5%. That line definitely left a mark. This was with upward revisions to government spending too.
Federal spending was revised up to 1.3% from 1.2%, while state and local spending was upgraded to 2.6% from 2.0%. Probably most importantly, GDI printed at growth of 1.5%, which is close to in-line with GDP which is where it should be.
Remember back in Q3 2023, there was a mismatch between the two, which is why there was and remains so much doubt about actual economic growth for quarters one through three for that year. Annualized q/q growth for Q1 through Q3 for 2023 average growth of 3.07% when measured in GDP, but just 0.97% when measured in GDI. Now, keep in mind the huge downward revisions to 2023 job creation data that the Bureau of Labor Statistics has already let us know through their BED report in April are on the way.
Put simply, the US economy is not, nor has it been as strong as has been reported. All the financial media had to do was connect the dots, but they obviously either don't care to, or don't want to.
The Atlanta Fed...
... will revise their GDPNow estimate for Q2 later this morning. After Thursday's upside surprise to the Goods Trade Balance for April, this revision should be to the downside. Currently, Atlanta sees Q2 GDP at growth of 3.6% (q/q SAAR), while across the other three regional Fed districts modeling Q2 GDP, the most optimistic is at 2.04% (New York). The St. Louis Fed, which has been the most accurate model of late, is at growth of 1.42%.
Economics (All Times Eastern)
08:30 - PCE (Apr): Expecting 0.3% m/m, Last 0.3% m/m.
08:30 - Core PCE (Apr): Expecting 0.3% m/m, Last 0.3% m/m.
08:30 - PCE (Apr): Expecting 2.7% y/y, Last 2.7% y/y.
08:30 - Core PCE (Apr): Expecting 2.8% y/y, Last 2.8% y/y.
08:30 - Personal Income (Apr): Expecting 0.3% m/m, Last 0.5% m/m.
08:30 - Consumer Spending (Apr): Expecting 0.3% m/m, Last 0.8% m/m.
09:45 - Chicago PMI (March): Expecting 40.0, Last 37.9.
13:00 - Baker Hughes Total Rig Count (Weekly): Last 600.
13:00 - Baker Hughes Oil Rig Count (Weekly): Last 497.
The Fed (All Times Eastern)
18:15 - Speaker: Atlanta Fed Pres. Raphael Bostic.
Today's Earnings Highlights (Consensus EPS Expectations)
Before the Open: DOOO (.65), GCO (-2.65)
At the time of publication, Stephen Guilfoyle was long NOW equity.
