Is the Market Building a Top?
Let's address the question that keeps coming up and where we stand for the rest of September. Plus, why the Utilities are important here.
You've reached your free article limit
You've read 0 of 1 free Pro articles.
The Market
Today I want to address a question I have been getting in one form or another for the last week or so. There are various versions of it, but basically, the question is if the market is building a top.
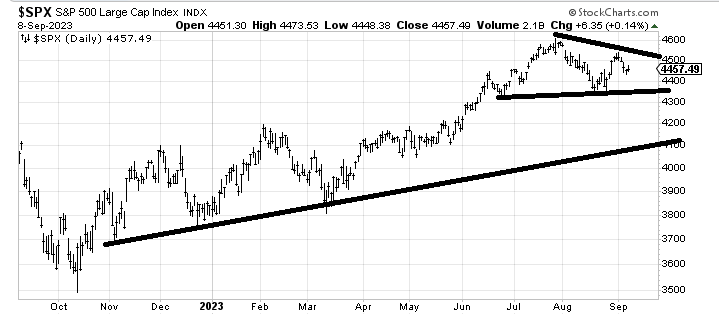
Let's forget the indicators for a minute and just talk charts. There are very few charts that have made a lot of progress since the spring. Just think of the S&P 500: It was 4450 in late June and it is 4457 as of Friday’s close. That’s a whole lot of nothing for more than two months. And I said I wouldn’t discuss indicators but for all that sideways action, sentiment got awfully bullish in early August.
So is it a top? Is that a head-and-shoulders pattern (top) that has formed? The pattern does have that look about it, but technically speaking the right shoulder (the late-August rally) is higher than the left shoulder (the June rally) so most textbooks would negate the pattern. A weak pattern is when the right shoulder is lower than the left, but that’s splitting hairs. If the neckline breaks, it is weak.
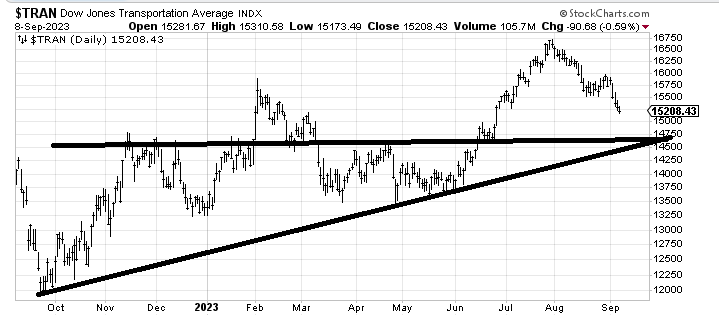
I would say that despite how crummy the charts look there is really only one chart that has made a lower low (lower than August) and that is the Transports. I have written about this for a week now and I still find it concerning, although the Transports are heading toward an oversold condition (as are many charts).
I think it is possible we're in the process of building a top but for my purposes -- again if we are just looking at charts, not indicators -- we would need to see either various groups take out the August low or major indexes do so. For example, the S&P would need to break 4300.
If we use the indicators -- and not sentiment or momentum ones but breadth indicators -- there is a case to be made that despite the upcoming oversold condition most stocks are not in great shape.
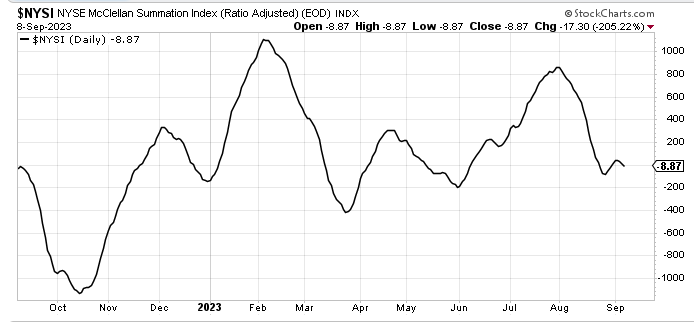
For example, the McClellan Summation Index barely rallied in late August and is turning down now. Before I dismiss it as big-time bearish, though, I do need to report that it would only take a net differential of +900 advancers minus decliners on the NYSE to halt the decline and turn it upward. But the late-August oversold rally was pretty pathetic.
If we look at the number of stocks making new lows, that too is not in great shape. The NYSE is hovering around 100 new lows, which is quite high for a market that is only a few percent off the recent rally high. On a 10-day moving average, new lows got to 80 in August, which is not much fewer than where they were in May when the S&P was nearly 10% lower.
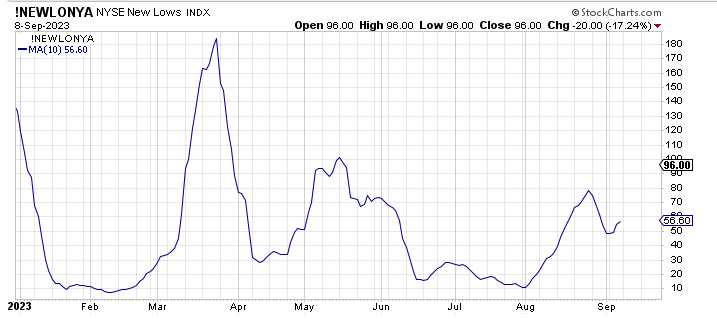
I would also point out that in the last four weeks the Nasdaq has seen breadth (advance/decline issues) positive for only eight days. While that is what I believe is setting up an oversold condition for mid-month, I think we can all agree that a healthy market does not tend to have so much negative breadth.
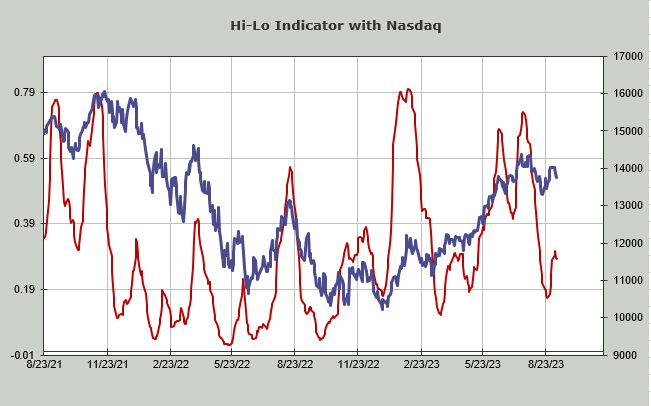
The Nasdaq’s Hi-Lo indicator is now at 0.28. That is heading back toward an oversold condition, but again, the Nasdaq is a mere 4% off the early August high, so shouldn’t the Hi-Lo Indicator be higher if there are that many stocks making new highs? The chart is shown below.
This doesn’t deter me from believing we will set up for an oversold rally again mid-month but I think it reinforces what I wrote about two months ago: The market is likely to be in a wide trading range and if we do rally in the latter part of September, it will push the indexes toward the top of the range.
New Ideas
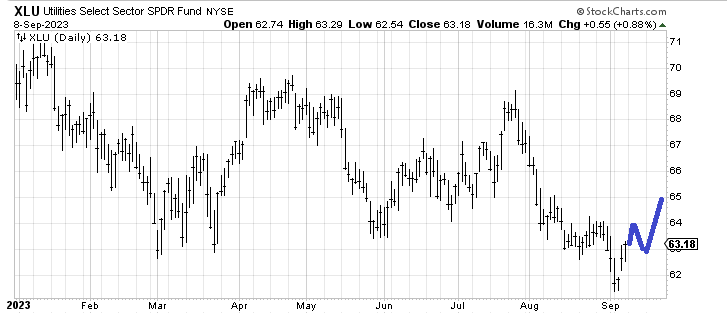
I know I keep hammering away about the Utes but I really do think they are important here. The Utilities Select Sector SPDR FundXLU closed a fraction above $63 on Friday so here they are at resistance. I would love to see XLU map out as I have drawn in blue, below.
Notice they peaked as we got overbought in mid-July and have been straight down ever since. If they can map out as I have drawn in then we really ought to get that oversold rally. And it probably means interest rates will come down as well.
Today’s Indicator
The Hi-Lo Indicator is discussed above.
Q&A/Reader’s Feedback
Helene welcomes your questions about Top Stocks and her charting strategy and techniques. Please send an email directly to Helene with your questions. However, please remember that TheStreet.com Top Stocks is not intended to provide personalized investment advice. Email Helene here.
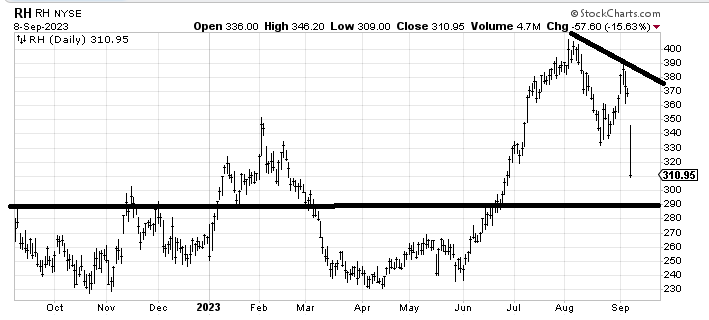
RHRH has a tendency to drop from a pattern like this (see February) and then it needs to go through a full fledged correction/decline/base building process. I see some minor support around $290.
Using a three-day rule for stocks that drop like that I would say if it gets into that $290 area in the next few days I would then expect a bounce but if you look at that February pattern, you can see how much time and price (down) it needed before it was buyable again. I’m not even sure where I would short it.
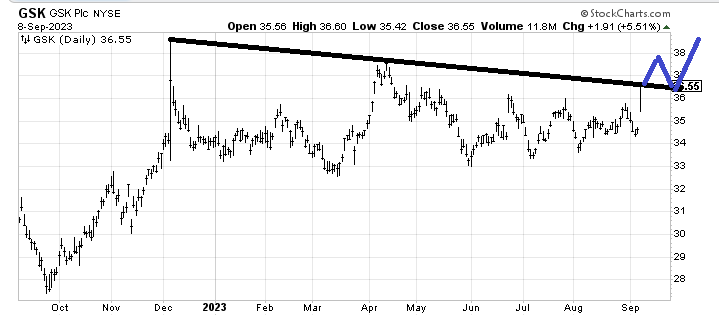
I was asked where GSK plcGSK can measure to now that this stock, which has been on my positive list for what seems like forever, finally popped. Of course, it finds itself right at resistance so the first thing it needs to do is get over that line like it means it, which means a follow-through day. If it can do that I would expect it to play out as I have drawn in with a target around that spike high from December last year ($39- ish).
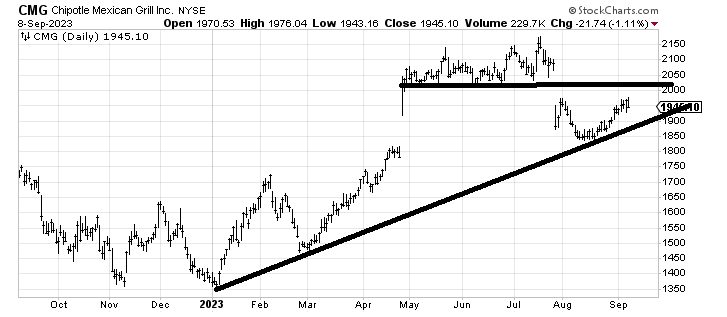
I am inclined to sell Chipotle Mexican GrillCMG in that $2000-2030 area as it would fill that gap. I would not do so if it gapped up over it though, only if it rallied to it.