Investors Get a Side of Speculation With Their Bullishness
The Nasdaq shows serious signs of speculation.
You've reached your free article limit
You've read 0 of 1 free Pro articles.
Since not much changed in the market during Monday’s rally, I want to go back to the topic I harped on yesterday: all those Nasdaq statistics that show serious signs of speculation.
Yesterday I noted that the ten-day moving average of Nasdaq’s volume was now at levels last seen in January 2021. I realize that most folks will think, no big deal because Nasdaq did not top out until November, but the majority of stocks peaked in January/February.
That was peak SPAC, peak biotech, and peak crypto for that time frame. We saw over 700 stocks making new highs on Nasdaq on a daily basis. Then, that number fell off a cliff. Keep in mind we had 667 the day after the election and haven’t seen that number again. On Monday, Nasdaq had 90 new highs.
In any event, the volume for Nasdaq on Monday was 8.5 billion shares, which was actually up about a half a billion shares from Friday. The NYSE saw volume fall a similar amount from Friday. That’s not where the speculation is.
Then I saw an article in the Wall Street Journal that had some interesting statistics I would like to share with you. The first is that trading in the over-the-counter market, which includes penny stocks, has surged 27% in November vs. a year ago. Sounds like speculation to me.
Then there is the fact that ETFs and mutual funds have taken in $56 billion last week. This is the second largest weekly haul on record. Their records go back to 2008. Inflows have been positive for seven straight months which is the longest streak since---wait for it—2021.
Finally, the Russell 2000’s etf (IWM) attracted $3.9 billion in inflows in a single session (the day after the election) which was the most since June 2007. Also not the most auspicious time to get on the bull train.
That’s an awful lot of bullishness but it goes along with the Citi Panic/Euphoria Model which is kissing the highs. It goes along with the 30-day moving average of the equity put/call ratio which is kissing the bottom on the range (both charts were shown here Monday).
And on Monday the ten-day moving average of the total put/call ratio came right back down to .85.
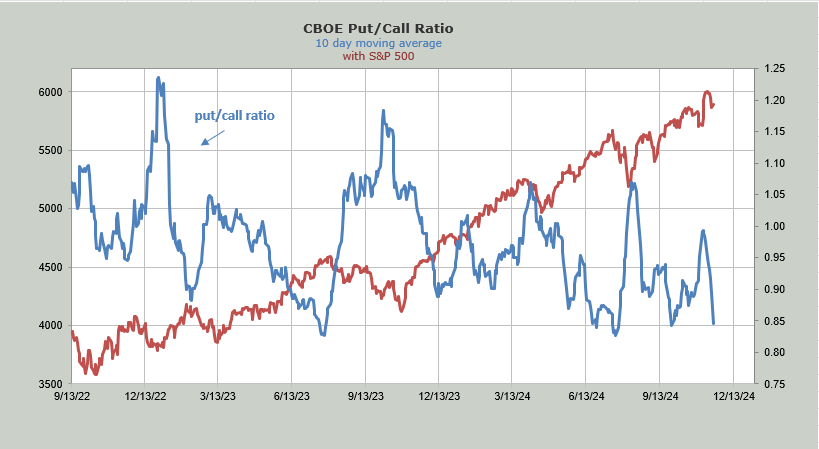
The end of the year, especially one that has been up so much, is generally going to keep the ‘up-ness’ into year end but all of these statistics speak of folks already pretty bullish on the market with a side of speculation.
Away from all of that I have some good news. Bonds have stabilized although much to my disappointment they have not rallied. However the Daily Sentiment Index (DSI) for bonds is now at 14. That gives me confidence that even if the bonds go splat from here, that DSI would be single digits and therefore I would have an awful lot of confidence they had gone too far and therefore would be a screaming buy. I still think bonds should rally.
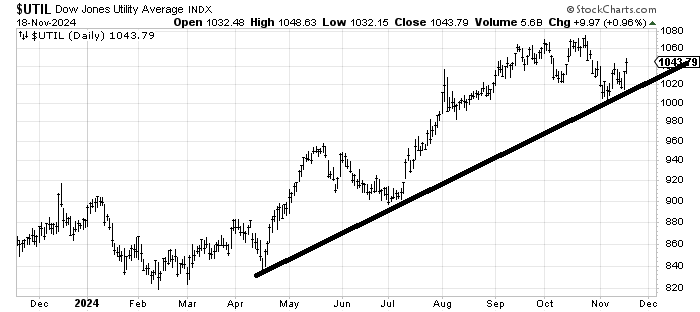
And heck, the Utes have rallied from that uptrend line I drew in two weeks ago. And are now green in the month of November. And for the first time in forever, no one even cares!