Inflation and the Economy, Unpleasant Macros, AI Spending, Latest Charts, Week Ahead
This weaker economy was just sitting there under our noses, and we foolishly chose to just go along with what we were told? Seems like it.
You've reached your free article limit
You've read 0 of 1 free Pro articles.
Fire and ice. Hot and cold. Hear it? Feel it? Markets rise... trading volume drops. Weak looking macroeconomic data hits the tape. Demand perks up for equities, at times for debt securities, and for commodities. Good with the bad? Good and the bad? Bad is good, good is bad? Something like that. First "they" priced in six rate cuts in 2024. Piece of cake. Like shooting fish in a barrel. Then there were three rate cuts priced in. Then none. Then two. What gives. Inflation beaten? Not yet. Economic slowdown?
Say "no", while nodding your head "yes." The headline data portrays what looks like a strong economy, or at least it did until late. Those numbers were in contrast to what you see and hear around you on an anecdotal basis. Then the BLS BED report wiped out almost half of the jobs created that the BLS had reported in 2023 as Non-Farm Payrolls. I've read Peter Tchir's T-Report for Academy Securities this weekend. He attributes a rough 60% of 2023 "job creation" to the BLS "birth-death model." Yikes.
So, this weaker economy was just sitting there under our noses, and we foolishly chose to just go along with what we were told? Seems like it. There are those still sipping the Kool-Aid. The Atlanta Fed's GDPNow model for the second quarter is currently showing growth of what I see as an absolutely absurd 4.2% (q/q, SAAR) pace.
Among other regional Fed districts running real-time GDP models for the second quarter, St. Louis is at growth of 2.37%, New York is at 2.23%, and Cleveland is at 0.71%. New York and St. Louis are pretty close to what I currently see. Readers should be cognizant that the St. Louis model has easily been the most accurate of late.
Rearview Macro
The major to mid-major equity indexes closed out the week deeply into the green on Friday. That said, both volume and breadth were less than impressive. Yields moved more or less sideways, testing both ends of a well-worn range. As the week expired, the US Ten Year Note paid 4.5%, as the Two Year paid 4.88%. The macro calendar was thin last week, and what we did see was sloppy.
The extension of consumer credit slowed in March as consumers pulled back on the use of revolving credit, wholesale inventory building for March contracted sharply, as a so-so auction of new US Ten Year paper was followed by a quite strong auction of US Thirty Year Notes.
Fed speakers were not really out in force, but those who were, really just recited what has become Fed mantra of late. Rates will be higher for longer. The fight against inflation goes on as long as those on the committee are not quite confident that inflation has been tamed and then returned to Pandora's box. As long as the economy "remains " strong.
What if labor markets have been less robust than we thought for more than a year now, and we were using faulty data? Crickets. Guess we'll just continue to go with the most optimistic data available in all circumstances and pretend that nobody out there is facing labor, food or shelter insecurity. The truth can be so darned unpleasant.
The most interesting slice of macro was released on Friday. The University of Michigan published the results of their April consumer sentiment and inflation expectations survey. Uh-oh. The headline number for consumer sentiment made like the Conference Board's April survey for Consumer Confidence and plummeted.
Bang, zoom, all the way from 77.2 to 67.4. Wall Street was looking for 76.2. That's some miss. Upcoming Q1 earnings from retailers could provide some more insight. Still, this was the worst print for this series since October. Awful, though not historically weak, within the survey however, those thinking that this is a good time to buy a home fell to their lowest level since 1978. How many readers were even born in 1978? Guidry went 25-3 in 1978, but that's another story.
Looking at inflation expectations.... One year out, the masses now see inflation at 3.5%, up from 3.2% a month ago. Five years out, inflation is now seen at 3.1%, up from 3.0% a month back. Ugly. Very ugly. Consumers see the economy faltering, while inflation accelerates.
Equities
By most "major" measures, US equities posted a third consecutive "up" week last week as trading volumes ebbed. The S&P 500 gained 0.16% on Friday to end the week up 1.85% and is now up 9.49% year to date. The Nasdaq Composite posted a tiny loss on Friday to close the week up 1.14% and now stands up 8.86% for 2024. The Russell 2000 gave up 0.67% on Friday, but still gained 1.18% for the week. The Russell is now up 1.61% 2024 to date. However, as Helene wrote on Sunday, the Russell closed lower on Friday than it did on Monday.
Looking over the rest of our mid-majors, the Philadelphia Semiconductors, Dow Transports, and KBW Banks all posted winning days on Friday, winning weeks over the past five trading sessions. However, while the Semis are up 15.15% for the year, and the Banks are up 10.44% for the year, the Transports are actually down 1.9% in 2024.
For the week, all eleven S&P sector SPDR ETFs closed in the green, led by the Utilities XLU for a second week in a row. The sector SPDR was up 4.18% last week after gaining 3.35% the week prior. We must ask ourselves, are the Utilities up 9.95% over the past month or so because the group is defensive in nature and many stocks within the group pay a nice dividend? Or are portfolio managers piling into these stocks due the unrelenting surge in demand for electricity they see as investment in AI-capable data centers only grows from here. Hmm.
On That Note...
Over the weekend, Tony Pasquariello, head of fund coverage at Goldman Sachs was quoted saying, " The biggest of the big continue to demonstrate their considerable muscle on two key fronts: return of capital ... and redeployment of capital."
Pasquariello added "The Magnificent 7 reinvests 61% of their operating free cash back into capex + R&D... that's trying to be 3x the 493." In other words, Pasquariello expects Apple AAPL, Amazon AMZN, Alphabet (GOOG), Meta Platforms META, Microsoft MSFT, Nvidia NVDA and Tesla TSLA to spend rough $348B on capex and that should amount to what is spent on capex by the other 493 companies that fill out the S&P 500 by three times.
There's More...
Wedbush analysts led by the five-star rated (by TipRanks) Dan Ives penned a note on AI this weekend. The note states, "While the first wave of the AI Revolution is being led by the Godfather of AI Jensen and Nvidia along with Nadella/Redmond (Microsoft)... now the 2nd/3rd/4th derivatives of this $1T of spending over the next decade is hitting the shores of the tech sector. We are seeing more breadcrumbs on the unprecedented AI spending wave from Arm Holdings ARM, Palantir PLTR, Oracle ORCL and others, which has reinforced this enterprise AI spending cycle."
The Charts
For weeks now, we have discussed whether or not, there has yet been any technical confirmation of this upward change in trend that appears to have occurred intraday on Friday, April 19th. While there is indeed some convincing evidence of confirmation, I am still not convinced. Let's take a look.
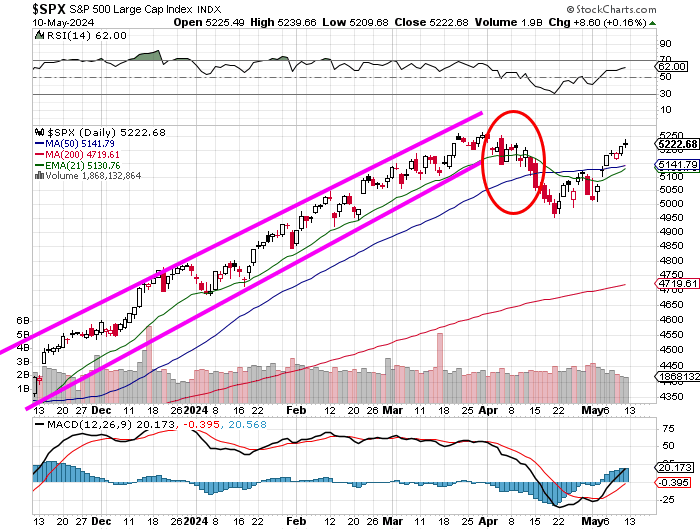
Readers will see that the S&P 500 has taken back both its 21-day EMA (exponential moving average) and 50-day SMA (simple moving average). Convincing? Relative strength has improved a bit, while the daily MACD (moving average convergence divergence) is now postured far more bullishly than it has been in quite some time.
Readers should also be aware that the 21-day EMA is closing back in on the 50-day SMA, which would create a mini or swing trader's golden cross. That's all positive.
What's not positive? Take a look at that trading volume. Much lower on "up" days than on "down" days. That means that more than a few managers are either behind on this rally, which would be bullish, or aren't coming along. That would be bearish. Either way, a volume-based confirmation, which is my favorite kind, is something we do not have.
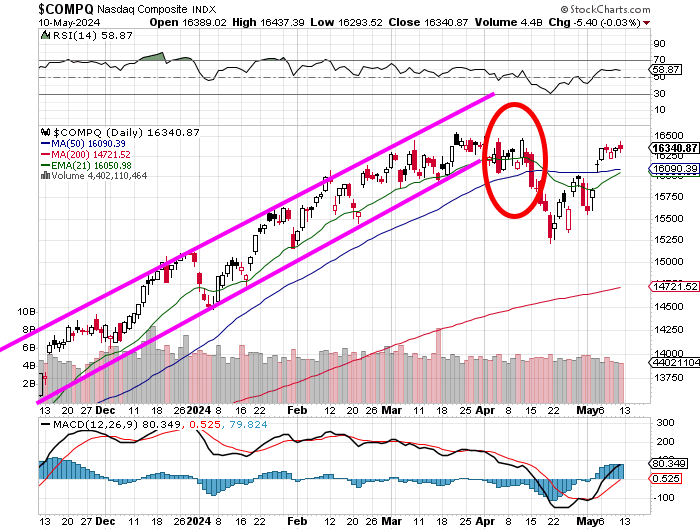
Here, readers will see that there is more than hope. I think. Many of the technical indicators mentioned above are moving in the same way here. Except for the trading volume. Aggregate volume across the membership of the Nasdaq Composite appears to be dwindling regardless of whether or not trading sessions end up higher or lower. That usually means some kind of increased volatility is coming, but it does not offer the promise of direction ahead of time.
Earnings
First quarter earnings season is winding down to its conclusion. All we have left is most of retail, one of the Mag-7, Nvidia, and assorted stragglers across a number of industries. According to FactSet, which is my long relied upon earnings data resource, with 92% (up from 80%) of the S&P 500 having reported for the season, 78% of S&P 500 companies have beaten earnings expectations, while 59% have beaten sales projections.
First quarter earnings are running at a blended (results & expectations) year over year growth rate of 5.4%, up from 5.0% a week ago and just 0.5% three weeks ago. Revenue growth is now running at 4.1%, which is where it had been. For the full calendar year, still leaning on FactSet, earnings are now seen growing 11.1%, up from 11% last week on revenue growth of 5%, up from 4.9%.
To this point, Communication Services are still running the hottest, at growth of 34.1%, with Utilities in second place at +33.4%. Three sectors, Materials, Energy, and Health Care are all still suffering year over year earnings contractions of greater than 20%.
After all of that, the S&P 500 ended last week trading at 20.4 times forward looking earnings, up from 19.9 times a week ago. This is still above the five-year average of 19.1 times and ten-year average of 17.8 times for the index.
The Week Ahead
The earnings calendar will be exceptionally light this week, but away from earnings, a heavy week of corporate events, macroeconomic releases and Fed speak lies ahead.
Earnings... Not much to look at. This week's headliners will be Home Depot HD on Tuesday morning, Cisco Systems CSCO on Wednesday afternoon, and then Deere DE, Walmart WMT and Applied Materials AMAT all on Thursday.
Corporate... On Monday, look for Open-AI, which is a Microsoft backed entity, to announce the launch of a new AI-integrated search engine in what will be an effort to take share away from Alphabet's Google Search. On Tuesday's it will be Alphabet's turn, as Google holds its annual I/O Developer Conference.
Fed Speakers... Right now, I am tracking 11 public appearances this week to be made by Fed officials. I am sure that more will crop up, but this is already a lot. Headliners will be fed Chair Jerome Powell on Tuesday morning and fed Gov Michelle Bowman on Wednesday afternoon.
Macro... The calendar is especially heavy this week. April PPI lands on Tuesday followed by April CPI and April Retail Sales and the Empire State Manufacturing Index on Wednesday. On Thursday, we'll see April Industrial Production, April Housing Starts and the Philadelphia Manufacturing Index. Friday brings the Conference Board's Index of Leading Indicators, which has not shown a positive month for the US economy since April 2022.
Economics (All Times Eastern)
No significant domestic macroeconomic data-points scheduled for release.
The Fed (All Times Eastern)
09:00- Speaker: Federal Reserve Vice Chair Philip Jefferson.
09:00 - Speaker: Cleveland Fed Pres. Loretta Mester.
Today's Earnings Highlights (Consensus EPS Expectations)
After the Close: STNE (1.44)
At the time of publication, Stephen Guilfoyle was long AAPL, AMZN, MSFT, NVDA. PLTR equity. Short META equity.
