Index Charts Show Some Sharp Teeth
Near-term bearishness is here, but this technical reading could offer some cushion.
You've reached your free article limit
You've read 0 of 1 free Pro articles.
All the index charts are now growling near-term bearish.
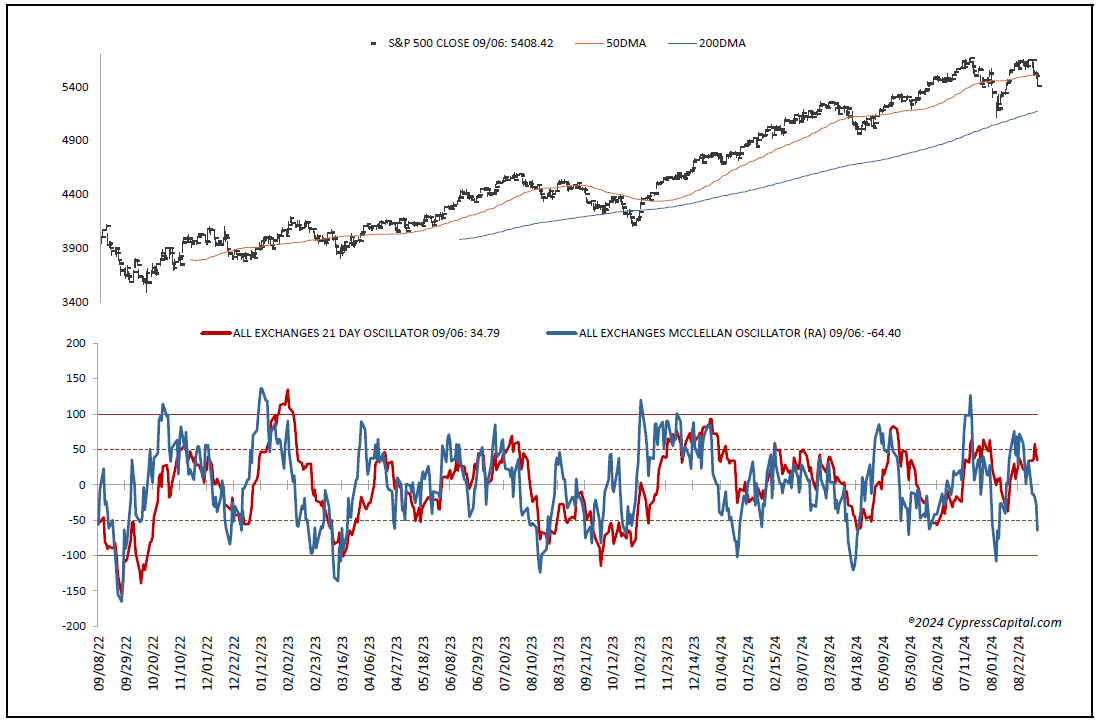
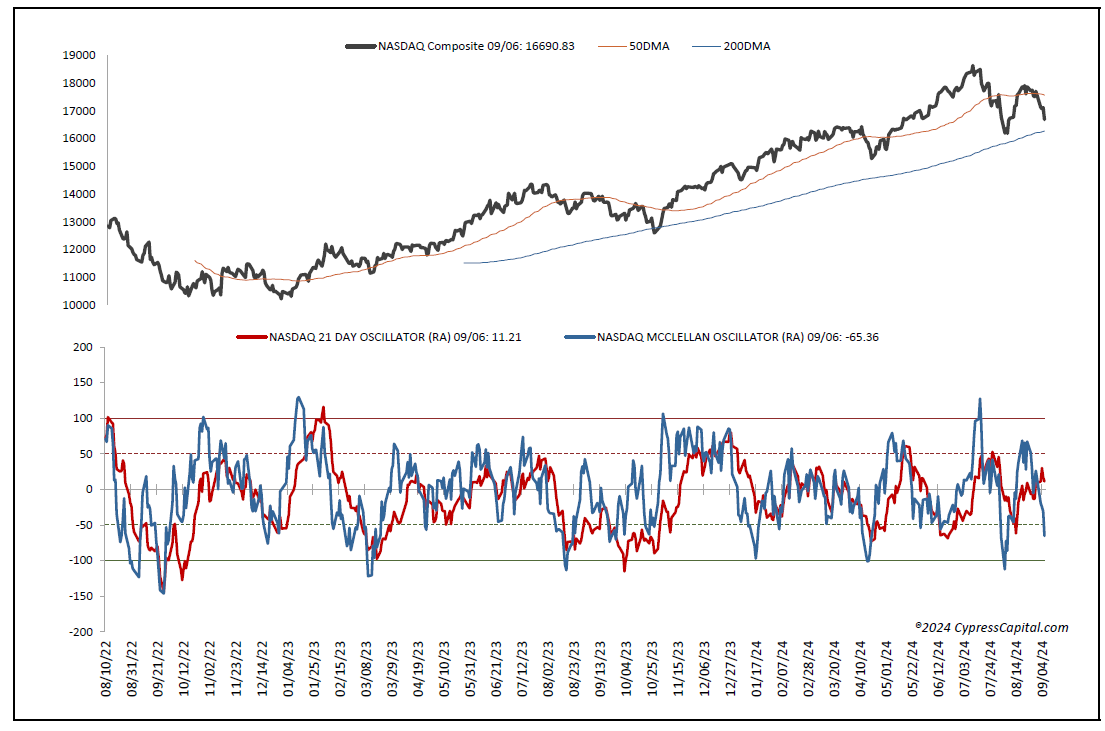
The good news, however, is the McClellan one-day overbought/oversold oscillators are oversold, which could offer some cushion.
Let's dig into the technicals.
First, all the major equity indexes closed notably lower Friday, with broadly negative New York Stock Exchange and Nasdaq internals. All closed below their respective support levels, leaving all the index charts now in near-term bearish trends as is cumulative market breadth. But the McClellan one-day overbought/oversold oscillators finally dropped into oversold territory that may provide a buffer for investors. (All Exchange: -64.40; NYSE: -65.59; Nasdaq: -65.36).
The rest of the data dashboard is only showing neutral signals, however, that have not yet generated readings that would strongly suggest the current weakness has spent itself. So, while we are not sellers of our current holdings, given their low valuation vs. projected one-year growth rates and strong earnings histories, we believe it’s a bit too early to sound the “all clear” siren for further buying.
The Charts
On the charts, all the major equity indexes closed lower with negative internals and near their session lows Friday on heavier volume.
The selling pressure forced all the index charts to violate their respective support levels that left all now in short term bearish trends.
Cumulative market breadth has turned bearish for the All Exchange, NYSE and Nasdaq, as well.
But some of the stochastic readings are now very oversold and in the low single digits that may offer some optimism. However, they have not yet generated bullish stochastic crossover signals that would make them actionable. As such, it’s too early to have strong confidence that the slide has seen its nadir.
The data is still largely neutral and not yet at levels that would suggest a high probability of some near-term bounce other than the one-day McClellan overbought/oversold Oscillators dropping into oversold territory.
The Technicals
The percentage of S&P 500 issues trading above their 50-day moving average, a contrarian indicator, slipped to 58% and stayed neutral.
The detrended Rydex Ratio, also a contrarian indicator, however, rose to 0.94, but stayed neutral, as well.
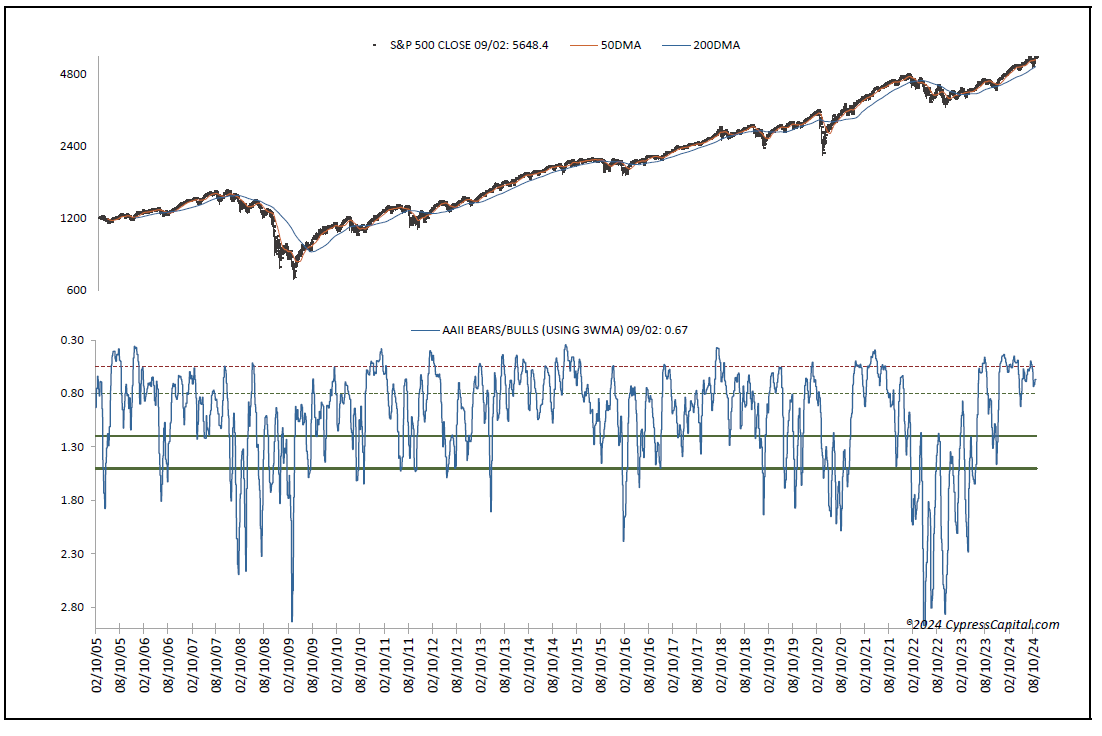
Last week’s American Association of Individual Investors Bear/Bull Ratio, another contrarian indicator,dropped to 0.67, but remained neutral.
Also, the Investors Intelligence Bear/Bull Ratio dropped to neutral from bearish at 21.9/50.0.
The prior excess of bullish sentiment, it appears, has dissipated.
The Open Insider Buy/Sell Ratio, meanwhile, is unchanged at 28.7% and neutral. They are not active buyers yet.
Finally, valuation remain a concern. The 12-month consensus earnings estimate for the S%P from Bloomberg rose to $258.37. Yet that leaves its forward price-to-earnings at 20.9, still well above the “rule of 20" ballpark fair value at 16.3. We believe this premium still presents some risk.
Its earnings yield rose to 4.78%.
Treasury and the Buck
The 10-year Treasury yield moved lower to 3.71%. Support is 3.70% and resistance at 3.94%. Its near-term trend is neutral.
The U.S. Dollar, via the Dollar Index Bullish fund UUP, closed higher at $28.18. Its trend is bearish with new support at $28.11 and resistance at $28.21.
The Bottom Line
In conclusion, Friday’s shakedown broke the charts and market breadth while the data is largely only neutral except, for the OB/OS oscillator that may offer some flooring. But while we are not sellers, it is too early, in our view, to be active buyers until more evidence suggests that to be appropriate.