In Search of an Oversold Stock Market
Let's answer some key questions that are likely on your mind Friday morning. Also, a close look at an important sentiment reading, and one indicator that's saying: 'Be on your toes.'
You've reached your free article limit
You've read 0 of 1 free Pro articles.
Note: I am taking a day off so my next column will be Tuesday, October 8.
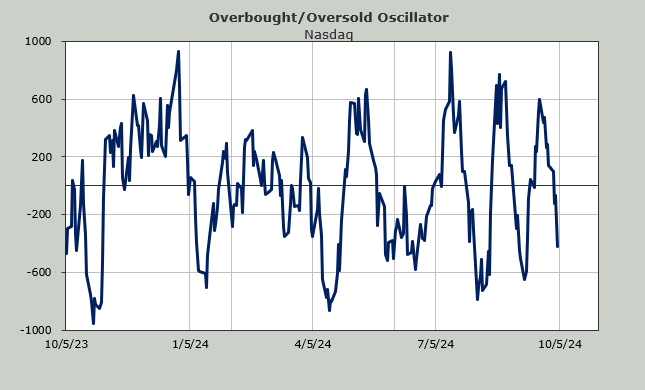
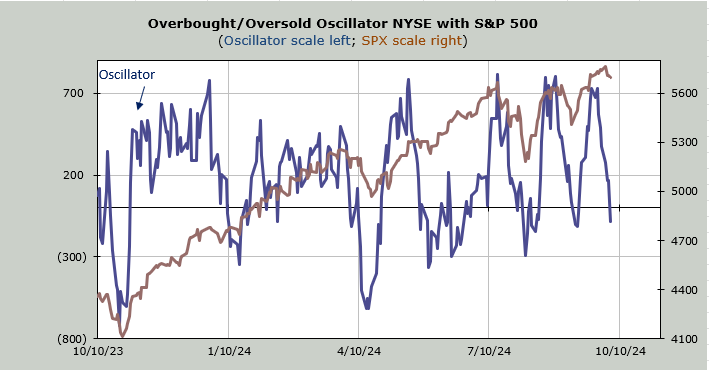
As we head into the September jobs report on Friday morning I can hear the questions: Isn’t that Overbought/Oversold Oscillator oversold? It is below the zero line, isn’t it?
It is below the zero line. And the math actually says the Oscillator could/should be up on Friday. But for next week that is not the case.
Recall this is based on breadth. It is the 10-day moving average of net breadth. So we look back 10 days to see what numbers we are dropping. For Friday we will drop a net negative -840. So for the Oscillator to keep falling we’d have to have net breadth at -840 or worse (for comparison sake, Thursday was -840).
For next week, though, we have the next five out of six trading days dropping positive readings. Now they are not big quadruple-digit readings but they are positive numbers. And that is why I can’t say this is oversold yet.
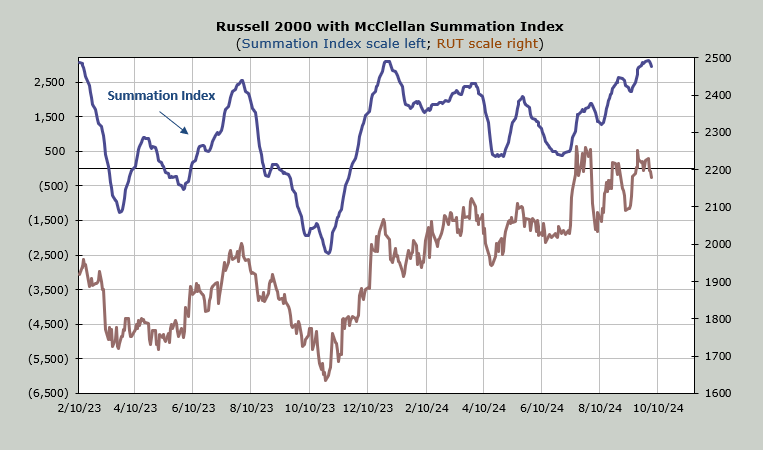
Take a look at the McClellan Summation Index. It is rolling over enough for you to see it now. It requires a net differential of +1,900 advancers minus decliners on the NYSE to halt the decline and more to turn it back up. To call this oversold that number needs to be around +3,000 or greater. So we can’t call this oversold yet either.
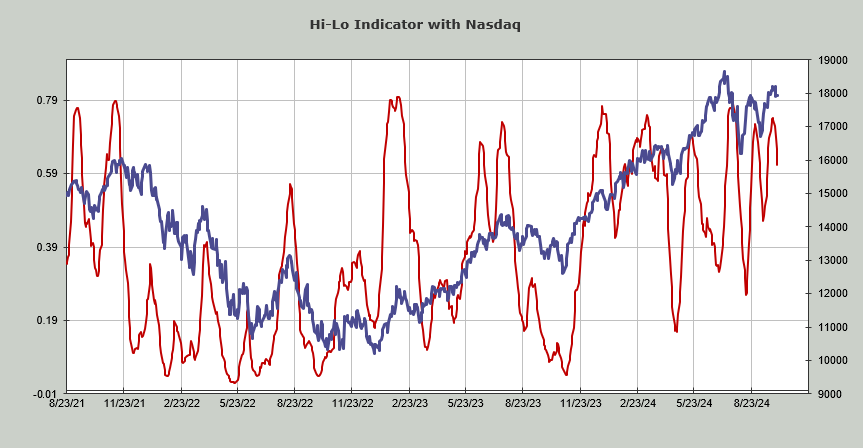
The good news is that the new lows have started to level off in that they haven’t expanded in a few days. The Hi-Lo Indicator is at 0.61. It’s going to need to come down more in order to be called oversold. In early September it got to 0.41. In August it got to 0.21.
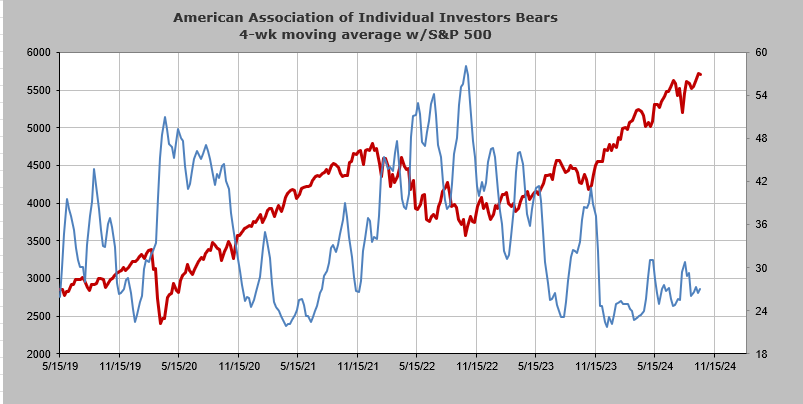
The American Association of Individual Investors (AAII) saw the bulls contract and the bears pick up but neither was meaningful. I find myself staring at the chart of the four-week moving average of bears. It made a low in December last year and has been rising steadily since. You can see the higher lows on the chart. Keep in mind this is a four-week moving average.
I figured that must be bullish, but look at this chart as we headed into the high in November 2021, here too the bears were on the rise, making higher lows. I’m not sure what to make of this but it is worth paying attention to. Some highs have this pattern while others don’t.
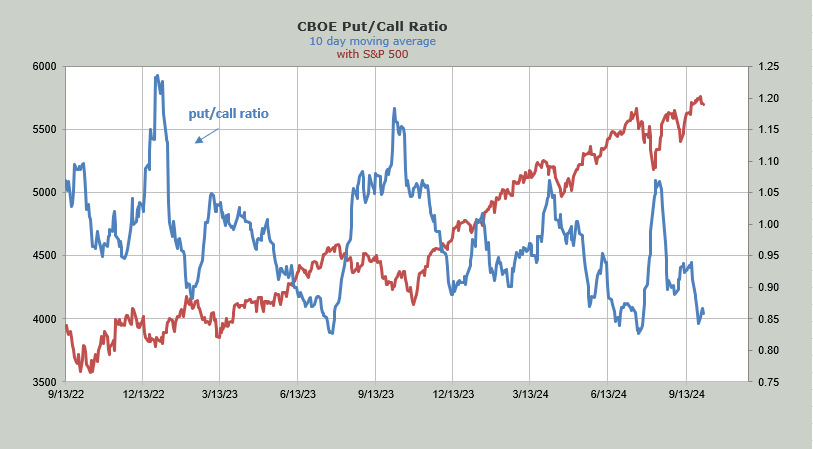
I am more focused on the put/call ratio because the 10-day moving average has not risen at all. It remains in an area that says be on your toes.
I will end by noting that the S&P 500 has been moving up/down/up/down for nearly two weeks now. If that pattern stays with us then Friday would be an up day. That’s if the pattern continues.