I'd Shop Around Before Buying Dell ...
The computer name beat earnings and could see shares up after the open, but the charts give me pause.
You've reached your free article limit
You've read 0 of 1 free Pro articles.
Dell Technologies DELL reported an adjusted earnings per share of $1.89 Thursday night, which beat estimates by $0.18. It posted revenue of $25.03 billion, which beat by $910 million. DELL is trading higher in the premarket Friday.
Let's check out the charts and indicators for some guidance.
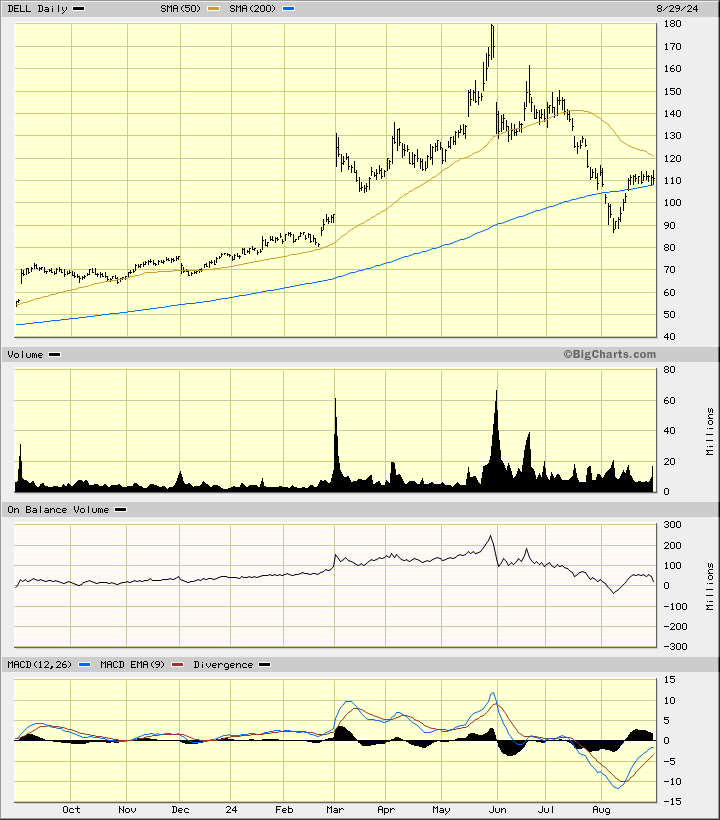
In this daily bar chart of DELL, below, I see the price action in DELL through Thursday's close. I have to imagine prices trading in the $117 area. I consider the technical setup of DELL as mixed at best. Prices have been correcting lower the past three months starting with a gap lower at the beginning of June. Trading volume on the decline was fairly active and tells me that investors voted with their feet.
The math-driven On-Balance-Volume (OBV) line made a peak in late May and has worked lower into August. A declining OBV line tells me that sellers of DELL have been more aggressive than buyers. The trend-following Moving Average Convergence Divergence (MACD) oscillator is below the zero-line.
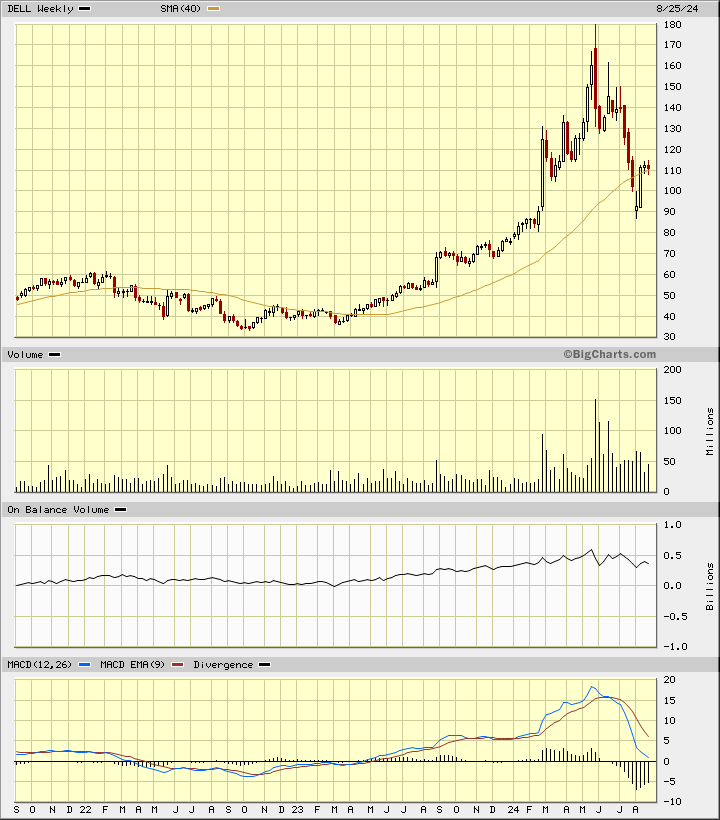
In this weekly Japanese candlestick chart of DELL, below, I can see the price action of the past three years. DELL made a base in the $40-$30 area back in the 2022 time frame before rallying into early 2024. Prices spiked up to around $180 rewarding buyers who had enough foresight to buy around $40. DELL quickly reversed direction and broke below the rising 40-week moving average line. Trading volume was active on the decline and the OBV line turned lower -- both signs of selling. The candles made a bottom-reversal pattern at the end of July and beginning of August. The moving average convergence divergence oscillator is still correcting lower and is pointed down toward the zero-line.
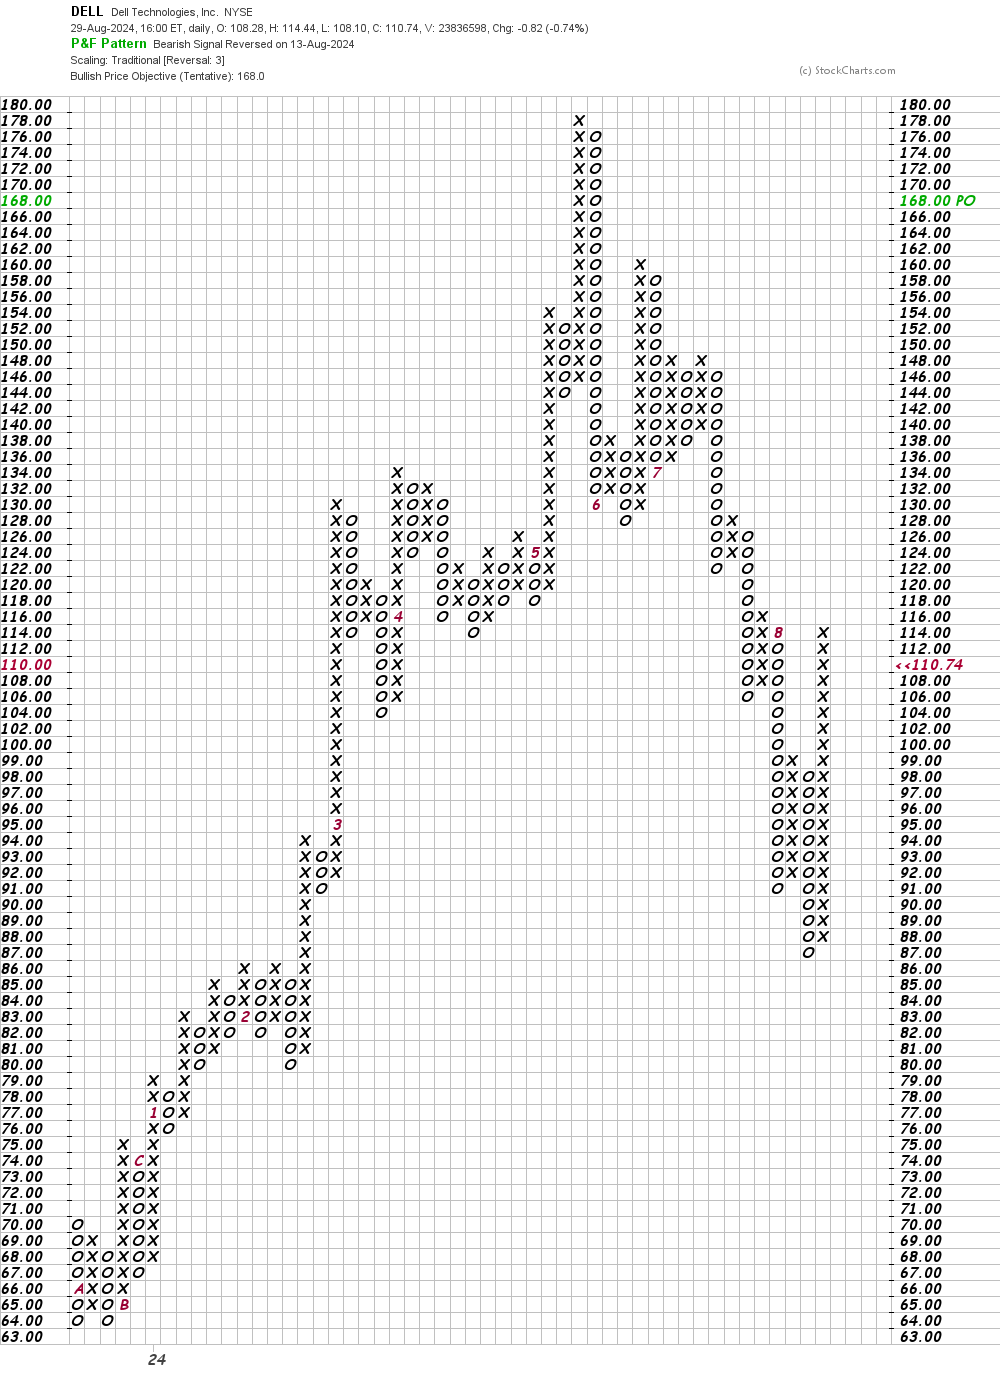
In this daily Point and Figure chart of DELL, below, I can see a potential upside price target in the $168 area. The pre-market action has not been plotted.
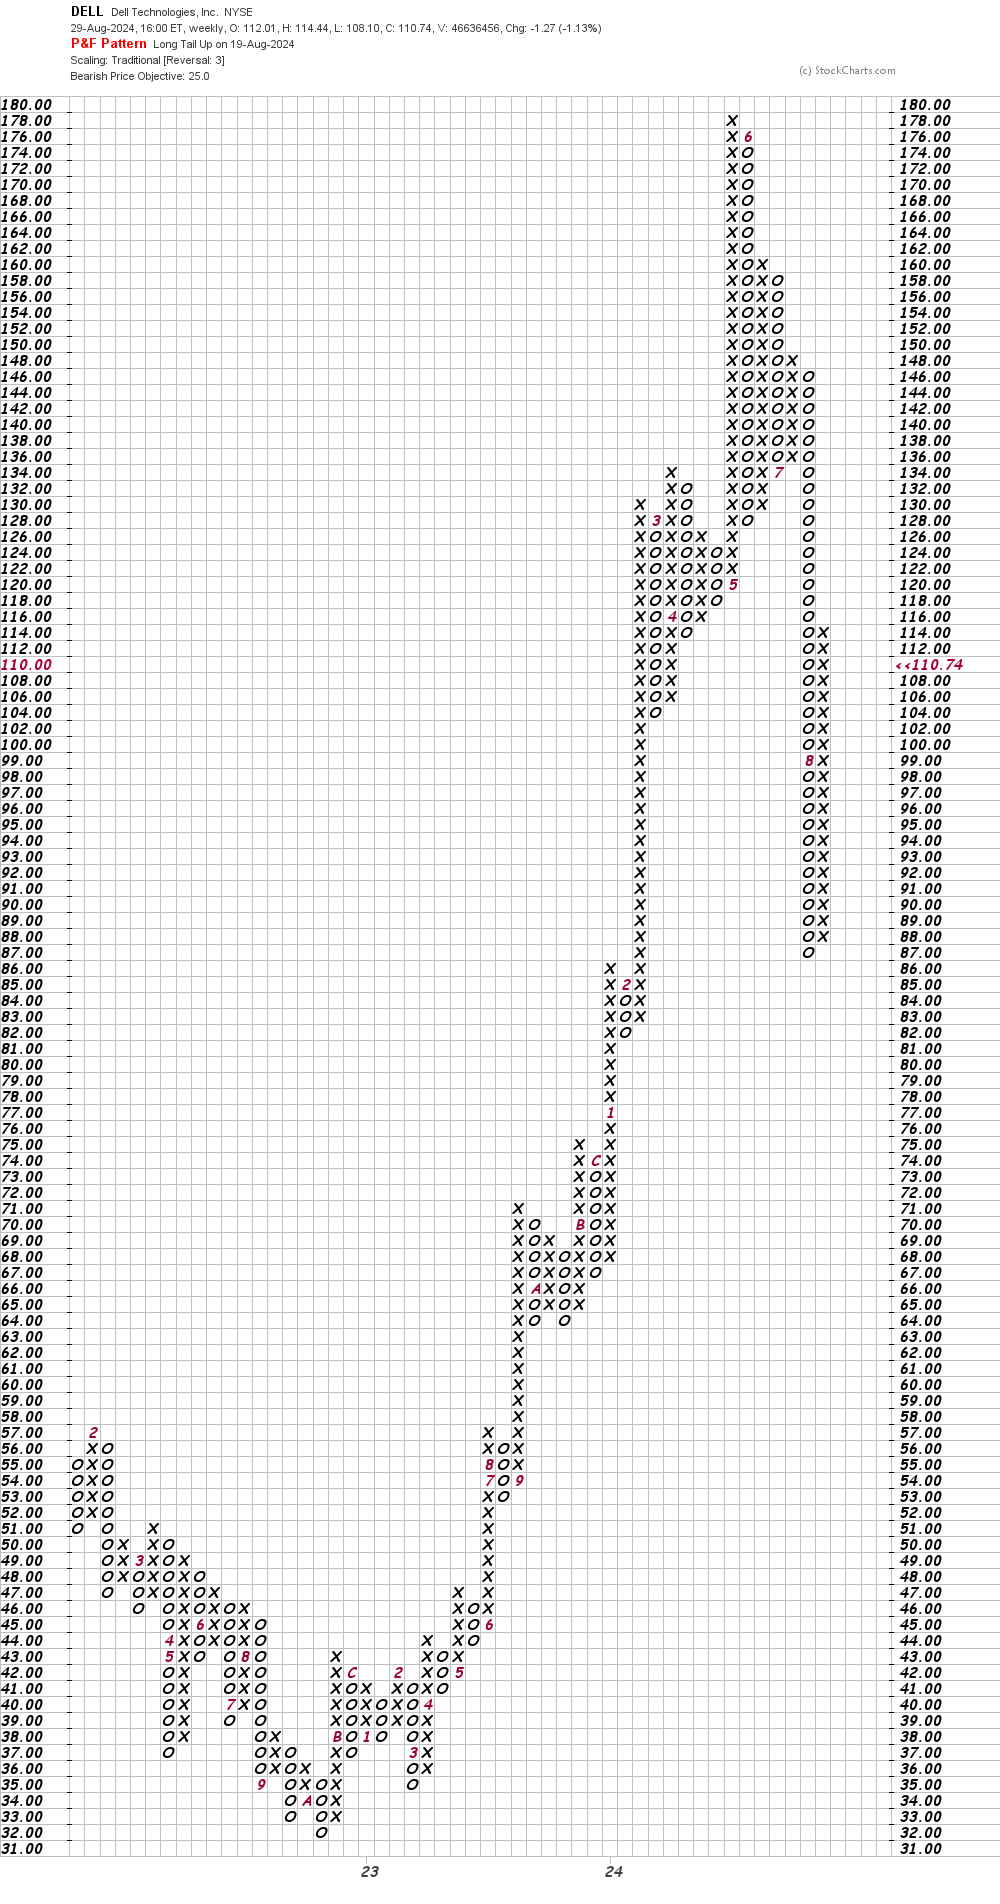
In this weekly Point and Figure chart of DELL, below, I can see a downside price target in the $25 area. I am not sure what prices need to trade at to turn this chart bullish.
Bottom line strategy: Shares of DELL are poised to open higher this Friday and the easy recommendation would be to suggest going long, but I am not so sure. The candles made a low on the chart (above) but saw no other clues that investors were buyers. I think some bottoming action is needed.
Employees of TheStreet are prohibited from trading individual securities.