I Give This Rally a B- (If I Grade It on a Curve)
Let's see how to rate Monday's action, when I being generous. Also, let's check Pepsi, Amazon, Aflac and more charts.
You've reached your free article limit
You've read 0 of 1 free Pro articles.
The Market
It was the best rally day for the Dow since June 2nd. I know the Dow is an index most don’t care about, but of the three major big-cap indexes, it has been the worst performer, so the that it had its best day since June is noteworthy.
How was the rest of the rally? I’d give it a B- although I did consider giving it a C+.
Let me explain why.
Breadth was fair and upside volume was only 67% of total volume. Bonds did not rally. It is important that the bond fund TLT crack that downtrend line or the yield on the 10-Year crack under 4.8%.
Geez, sounds like I should have given it a D! Well, the Volatility Index came down and here’s the indicator I am focused on most: the McClellan Summation Index needs a net differential of +600 advancers minus decliners on the New York Stock Exchange to halt the decline. A week ago, that number was +2,600. The week before that it was +200, but we were heading into an overbought condition. Breadth has to improve enough to get that turned up while the oversold window is open.
As I am sure you know, the Fed meets on Wednesday, so that will be market moving as will the Employment number on Friday.
The bottom line is I think we could give some of today’s rally back tomorrow, but I’ll watch breadth (can it improve?) and interest rates (can they break 4.80% on the Ten Year?).
New Ideas
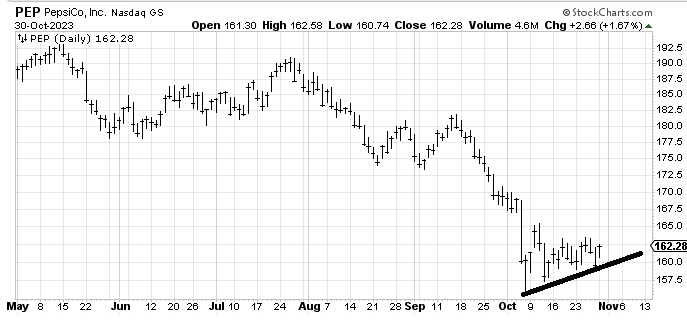
I still think Pepsi PEP is trying to bottom. It really needs to get up and over that $163 (then $165) to get any traction, though, but it has higher lows.
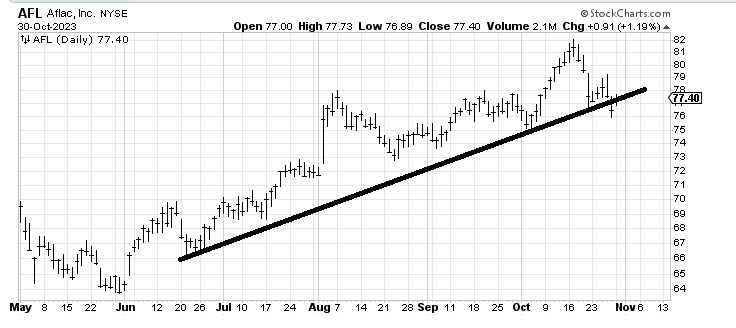
I want to follow up on Aflac AFL as stock I was asked about last week. It dipped under that uptrend line and rallied today. If this current rally can’t get back up over $79 I’m a seller.
Today’s Indicator
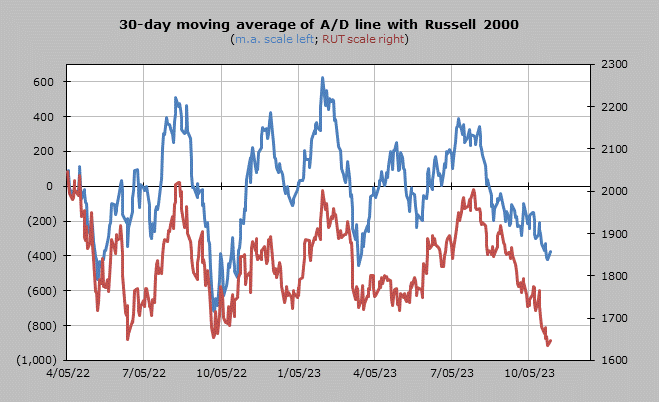
The 30-day moving average of the advance/decline line is oversold.
Q&A/Reader’s Feedback
Helene welcomes your questions about Top Stocks and her charting strategy and techniques. Please send an email directly to Helene with your questions. However, please remember that TheStreet.com Top Stocks is not intended to provide personalized investment advice. Email Helene here.
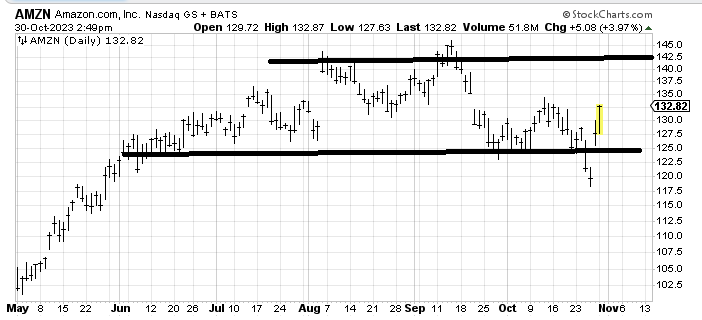
AMZN? Meh: About a month ago folks were so hysterical over a 2% or 3% move in Amazon AMZN and I shrugged, thinking it is the same price it was in July. Now I look at the chart and my inclination is also to shrug and say it is the same price it was in July!
It is possible that last week’s two day move under $125 was a false breakdown, but I’m inclined to think the stock fills the gap at $135 or so and then we take another look at where the market is and what sentiment is like. Mostly I would expect Amazon is still just in a big sideways range for now; notice how it had a two day breakout in early September that didn’t stick, either.
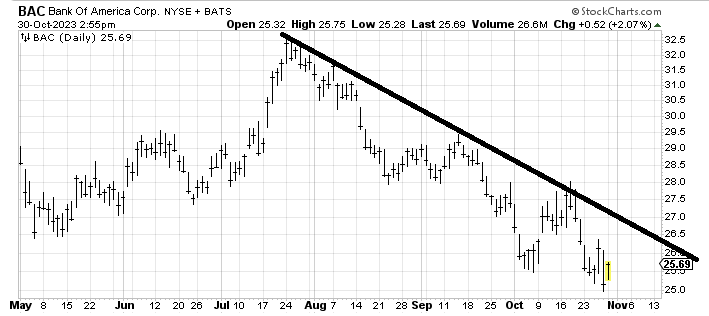
Back in BAC? What of the banks? We got lucky a few weeks ago when I said I’d sell Bank Of America BAC at around $2 but should we buy it back now for a rally? I confess that the banks are intriguing to me here for a rally. BAC could rally back to $27-$28, but I would want to keep a tight leash on it and if it falls back under $25 I would give up on that notion immediately.
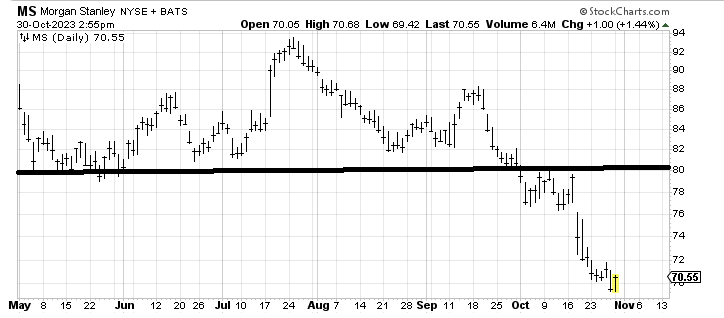
Morgan Plan: Morgan Stanley MS had a next target in the $65-$70 area, so it got into the top of that range which means it ought to enjoy a short-term rally. That’s the best I can say right now. If it can get to $76-$78 I’d be a seller.