Here's How the Short-Term Oversold Condition Is Likely to Play Out
Things are shaping up short-term, but the intermediate-term is 'just not prepared.' Plus a look at the much requested GLD, Palo Alto, TLT and more.
You've reached your free article limit
You've read 0 of 1 free Pro articles.
The Market
Well we got a rally, lethargic as it was. I do think if the market retreats again on Tuesday or even Wednesday it sets us up for another oversold rally. That’s just how the short-term oversold condition looks to be shaping up.
For example, you can see the Overbought/Oversold Oscillator lifted quite a bit in the last few days. A down day or so should give it a higher low and set it up to be oversold one more time.
But is the intermediate-term oversold? Not yet. The Nasdaq Hi-Lo Indicator, as expected, did dip into oversold territory Monday when it chimed in at 0.18. The NYSE still has room to go with its reading at 0.39.
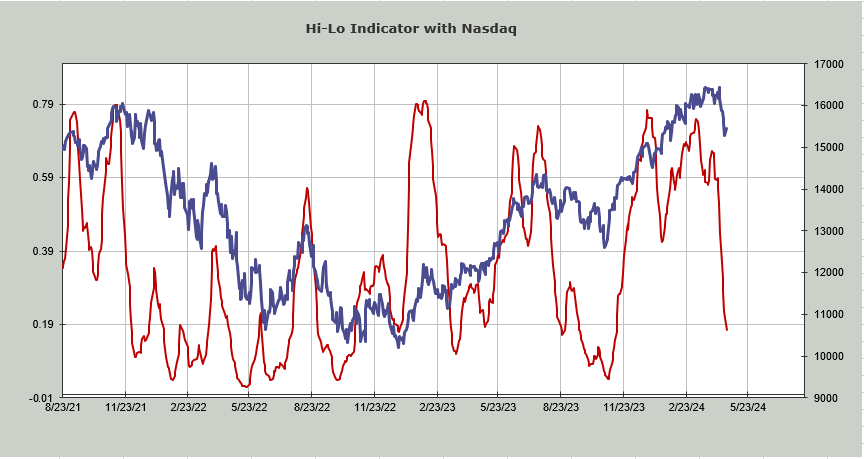
But that’s the only intermediate-term indicator that is oversold. The Volume Indicator actually ticked up to 0.49 Monday so that’s not oversold.
I do want to discuss the 30-day moving average of the advance/decline line, what I use as an intermediate-term overbought/oversold oscillator. What I do is I look for a long string of negative numbers to be dropped. That is what gives me confidence that we are intermediate-term oversold. With that in mind please take a look at the numbers this will drop for the next two weeks.
There is exactly one "red" (negative numbers) day. I can’t tell you this is oversold at least until sometime in May and even at that right now it looks more choppy than a good oversold. The chart is down below.
| Day | 30-Day MA |
|---|---|
Tuesday | 16 |
Wednesday | 293 |
Thursday | 541 |
Friday | (1,646) |
Monday | 307 |
Tuesday | 44 |
Wednesday | 1,084 |
Thursday | 1,578 |
Friday | 1,024 |
This table above is just another reason why I think whatever short-term rally we get will then come back down again. The intermediate-term is simply not yet prepared.
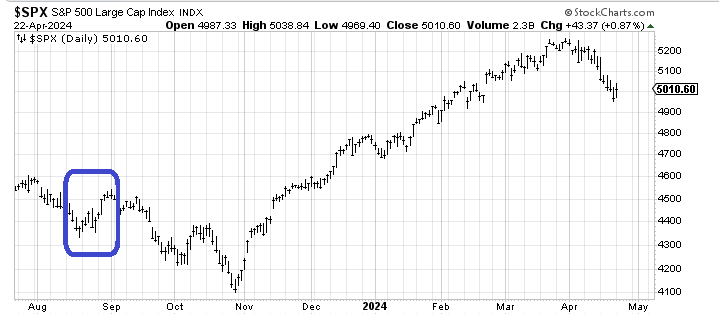
The pattern need not be exact but I continue to highlight that late August period where we struggled to get an oversold rally and then we got one but after we resumed the downside.
Happy Passover to all who observe!
New Ideas
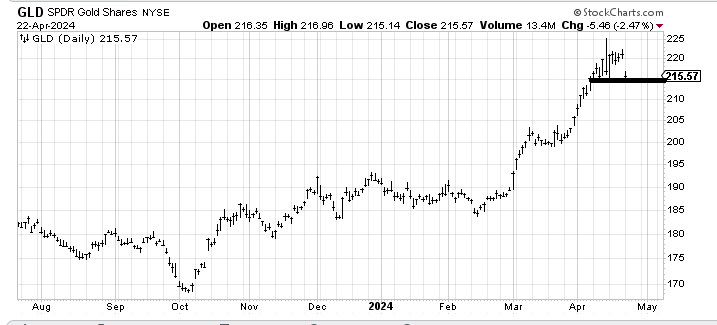
I want to address SPDR Gold Shares GLD since my inbox is filled with folks dying to buy it. I said last week I was neutral and in favor of taking profits and I still feel that way. I would not be surprised if this $215 level breaks before this corrective move is done. Right now I’d be a seller on a rally to $220-ish.
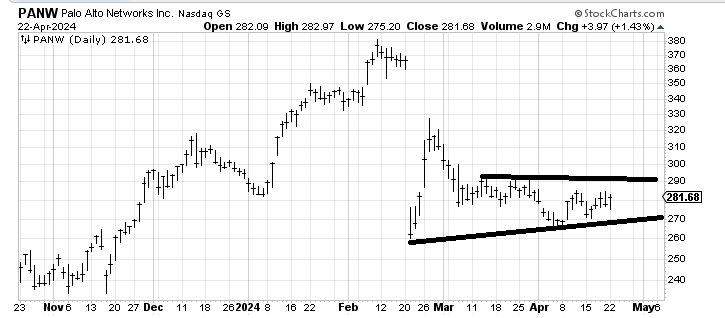
I am still waiting for Palo Alto Networks PANW to rally up to $290 (and maybe over it). My stop is under that $270 area.
Today’s Indicator
The 30-day moving average of the advance/decline line is discussed above.
Q&A/Reader’s Feedback
Helene welcomes your questions about Top Stocks and her charting strategy and techniques. Please send an email directly to Helene with your questions. However, please remember that TheStreet.com Top Stocks is not intended to provide personalized investment advice. Email Helene here.
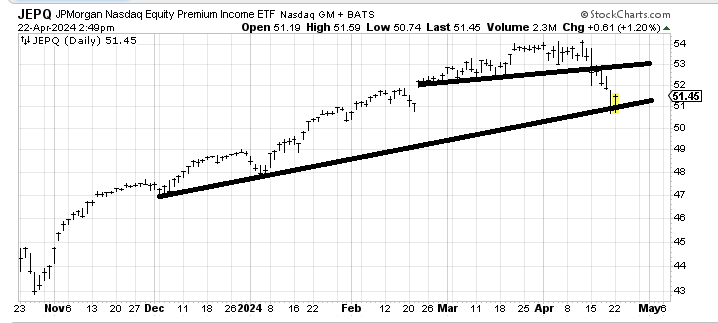
JPMorgan Nasdaq Equity Premium Income ETF JEPQ has bounced off support and will now run into resistance $52-53. I would expect it to back off from that resistance. However, if it holds that lower line on the next trip down, that would be a positive. For now it's trapped between the two lines.
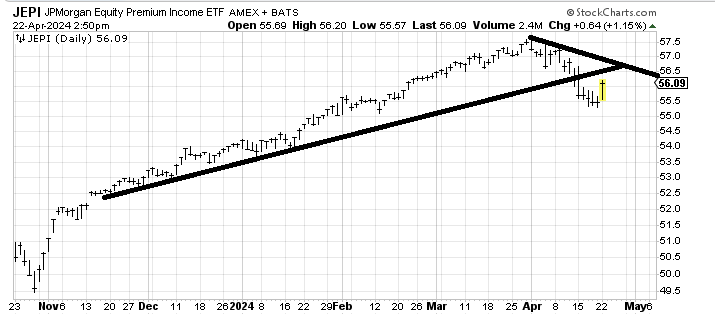
JPMorgan Equity Premium Income ETF JEPI looks to me like it runs smack into resistance in the $56.50-57.00 area.
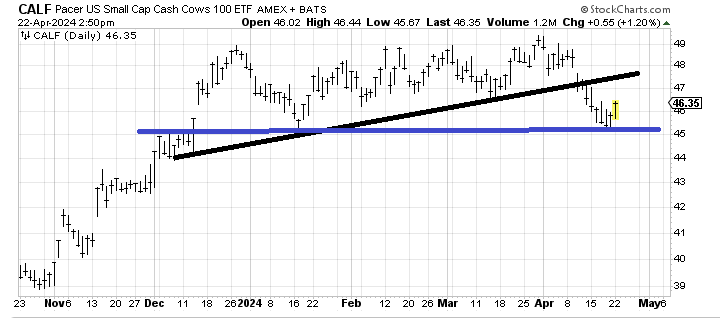
Pacer US Small Cap Cash Cows 100 ETF CALF should run out of steam around $48-ish where it would fill a gap. For now I will call it trapped between $45 and $48 but if it breaks the blue line I think we’d be looking at a gap fill near $41.
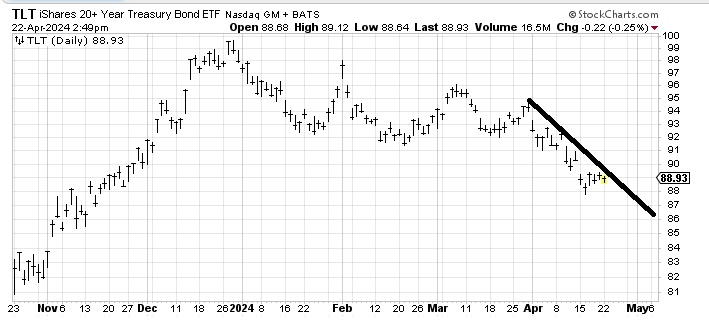
I am still looking for a bounce in the iShares 20+ Year Treasury Bond ETF TLT. So far it has only been able to manage a buck. I have thought $91-92 is where it can go but it must get over that downtrend line to prove me correct.