Here's Where Treasury Yields Could Be Headed — And It's Not Good for Stocks
The 10-Year is at its highest rate since ending its decline in late December.
You've reached your free article limit
You've read 0 of 1 free Pro articles.
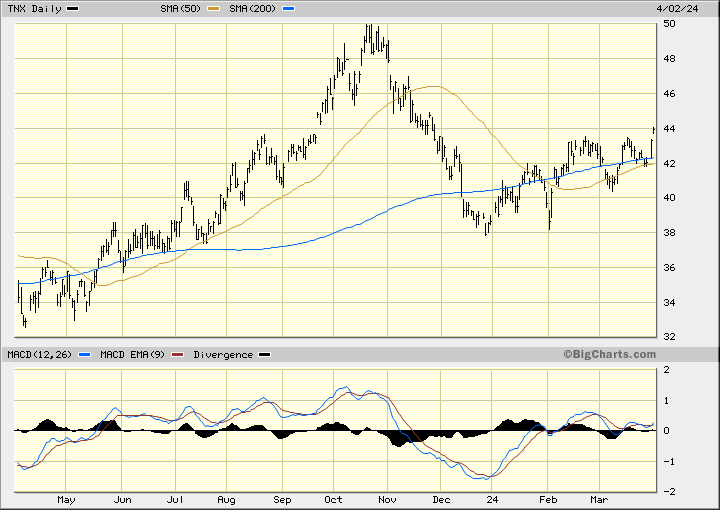
The yield of the 10-Year Treasury (TNX) is testing the 4.40% level Tuesday and is at a new high rate since ending its decline in late December.
Let's upset those "seat of the pants" bond traders with some charts and indicators.
In the daily bar chart of the yield on the 10-Year, below, I can see they have trended higher since late December. The slope of the 50-day moving average line and the slower-to-react 200-day line are positive.
The Moving Average Convergence Divergence (MACD) oscillator has been above the zero line since early February.
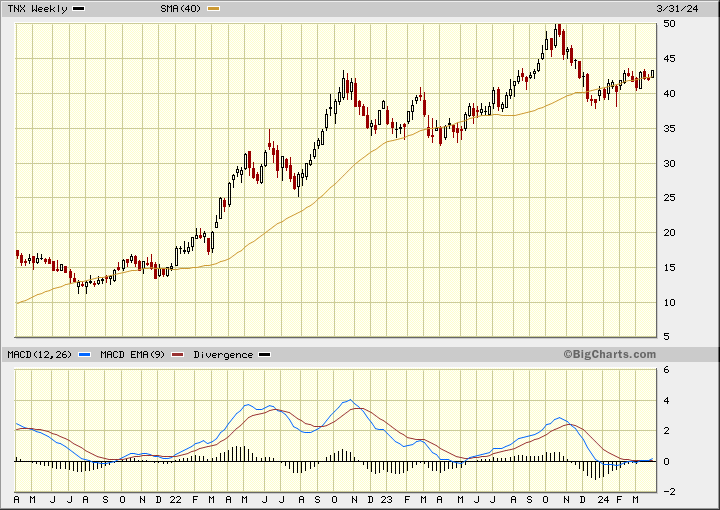
In this weekly Japanese candlestick chart of the 10-Year yield, below, I can see that yields have risen the past three years. Yields are moving above the rising 40-week moving average line.
The MACD oscillator is slightly above the zero line.
In this daily Point and Figure chart of the 10-year yield, below, I can see a potential target in the 5.35% area.
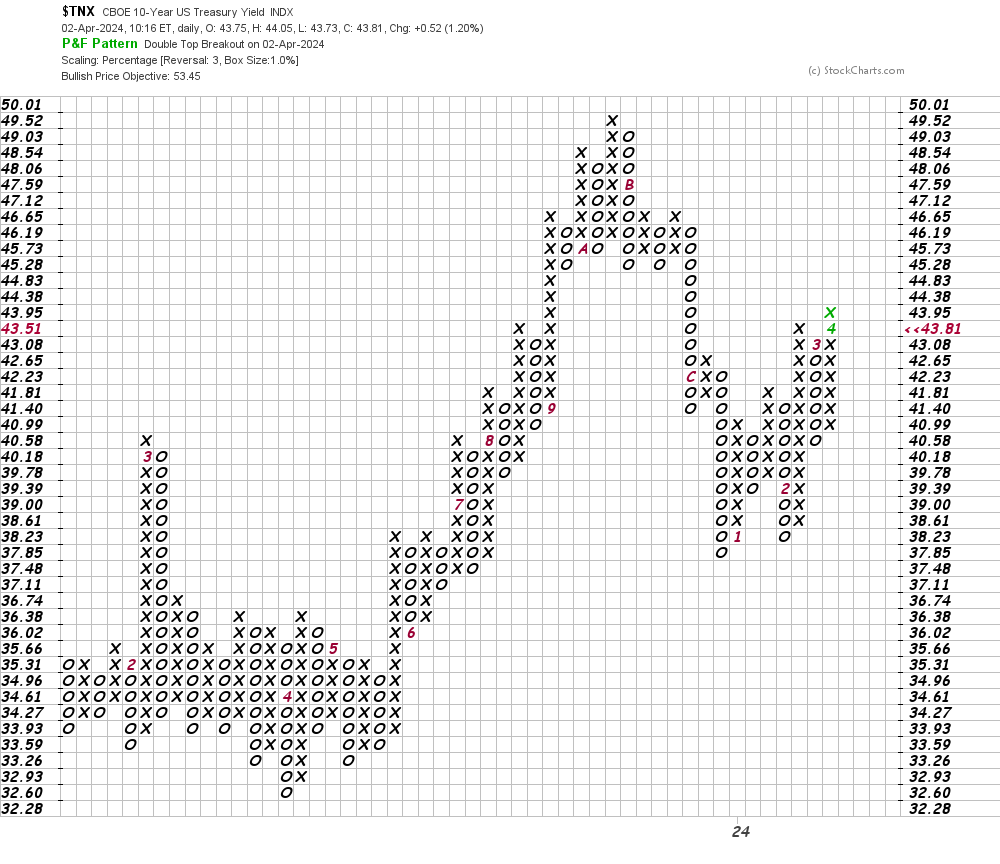
Bottom-line strategy: The rise in yields is probably not over and thus the decline in stock prices has further to go.
Employees of TheStreet are prohibited from trading individual securities.