Have We Crossed the Giddy Threshold? Yes and No
The S&P 500 still appears to be knocking on the door while Nasdaq is making itself at home.
You've reached your free article limit
You've read 0 of 1 free Pro articles.

So, did we cross through the doorway into giddy? Yes and no.
I admit that I am surprised, but then I always am, that the "last mile" to get the Daily Sentiment Index (DSI) from 15 to single digits or from 85 to 90 takes so much effort on the market’s part.
Nasdaq’s DSI inched up to 85 and the S&P is now at 82. But the VIX’s DSI edged down to its first teenage reading at 19.
I put the S&P still in the "knocking on giddy’s door" camp and Nasdaq has steeped over the threshold — call it with one foot on either side. The VIX is similar to Nasdaq. As a reminder, Nasdaq did not get to single digits at the low but rather stopped at 12. So it need not get all the way there but I do find it an easier call when it does.
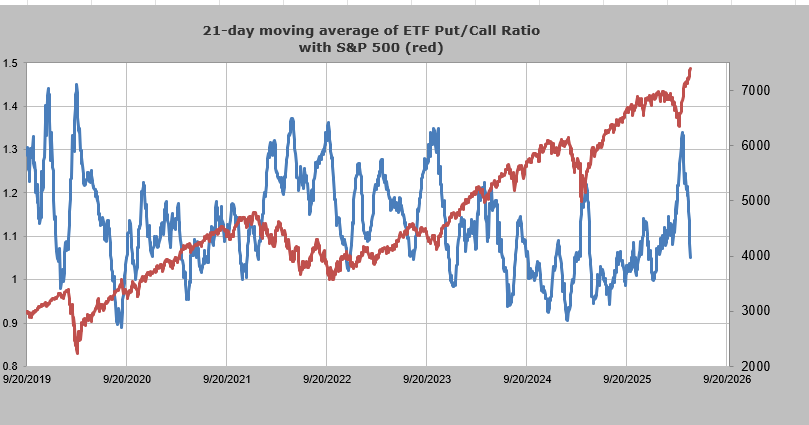
We haven’t looked at the 21-day moving average of the ETF put/call ratio since we were at the lows and I shared this chart with you on an almost daily basis because it had gotten so high (too much hedging). It has not fallen as much as the total put/call ratio or the equity put/call ratio, but it is now just a bit over 1.0. If it fell under 1.0, I’d consider that it has begun knocking on giddy’s door.
I look forward to seeing if the Investors Intelligence bulls can get themselves up and over 55% this week as well. Giddy in that survey is when we have four bulls to every bear (bull/bear ratio over 4.0). It is currently just over 2.0, so that is unlikely to get to giddy this week.
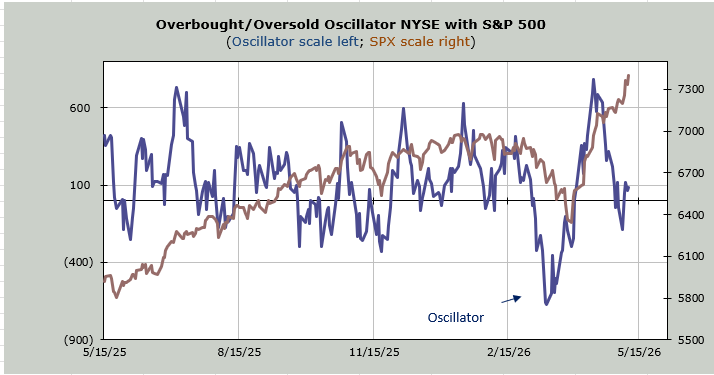
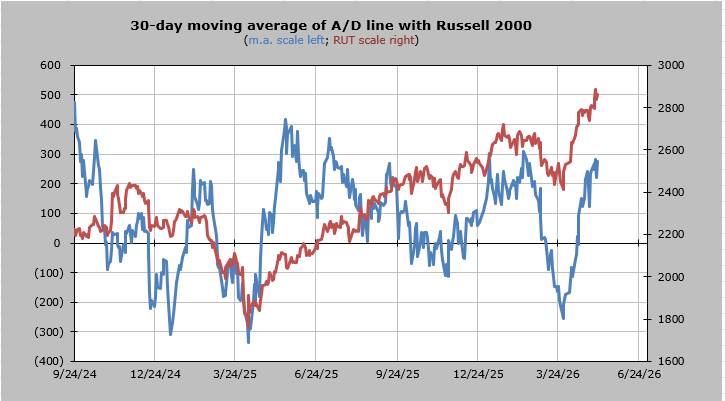
My indicators are set to get intermediate-term overbought around midweek this week. The 30-day moving average of the advance/decline line will be overbought Wednesday. Remember this is not meant to catch the exact day but rather the general time frame.
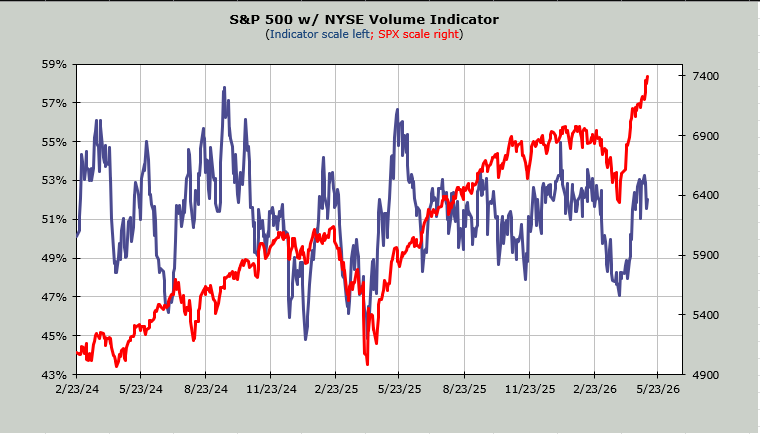
The Volume Indicator still sits at 53%. Over 55% is overbought. But consider for a minute how narrow this advance has been if we can’t even get the 30-day moving average of upside volume to get over 55%.
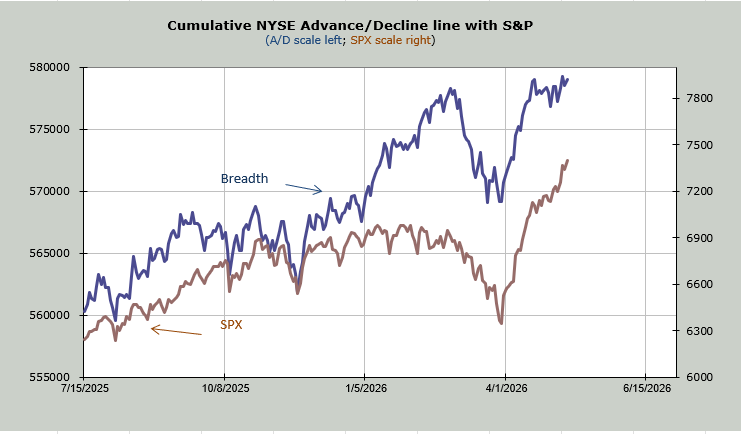
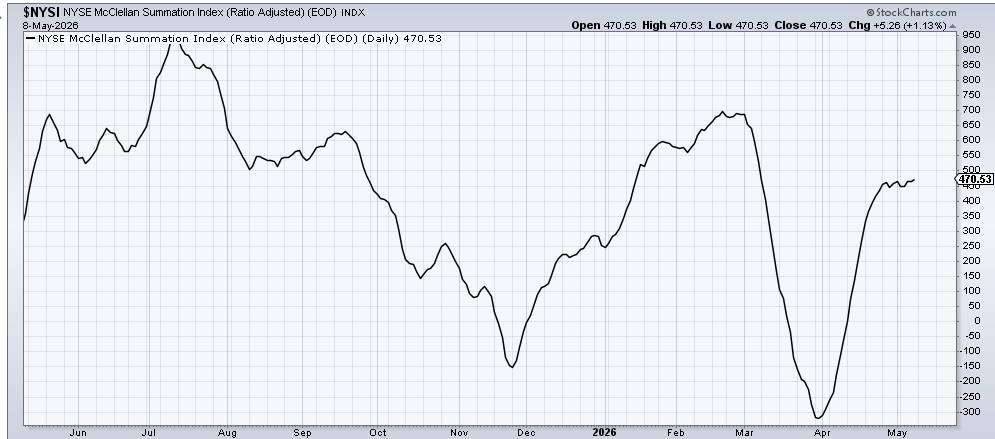
That brings us to breadth. It’s not terrible. Terrible would be if the McClellan Summation Index was rolling over. It is currently just stalled. But you can see (blue line) breadth has not kept pace with this torrid rally. Breadth is barely over the level it was at when the S&P was 6900, yet the S&P is now 7% higher.
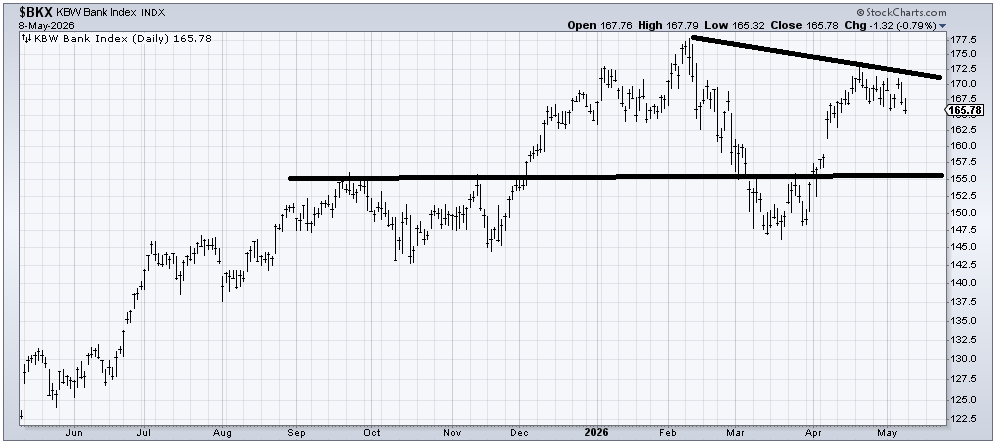
We can see the lack of breadth is the fact that so few groups have made a higher high. But I would highlight, once again, the banks are now 7% off their February high, and 5% off the April high. Perhaps this is just part of the short-term overbought condition we got three weeks ago, but I notice no one talks about the banks the way they did as we entered the year when they were the most recommended group.
A correction is needed. I would like to see if we can get some of these indicators into giddy by the end of this week.