This Parallel With 1999 Is What Has Me Most Bothered About Our Market
I got a lot of polarized feedback when I suggested this market is similar to the 1999 to 2000 dot-com frenzy.
You've reached your free article limit
You've read 0 of 1 free Pro articles.

The Market
I had an interesting experience this past weekend. On Friday I saw Intel (INTC) up by 17% in the middle of the day and, as you already know, earlier last week I said I did not think the SOX had gone parabolic, but I did think Intel was on its way so I tweeted out the following:
"If you weren’t trading in 1999-2000 then you are in luck. This is what it was like. Now you can experience it."
Please note that I did not say when in that time period nor did I use the words "bubble," "parabolic," "blow-off," or any such term. I was simply reacting to the fact that Intel, which had already nearly tripled in the last month, was up an additional 17% on the day. One could have easily taken that as a bullish comment with the thought that there’s more to go.
Yet almost every single reply, whether positive or negative, figured that I meant that comment as bearish. So, let’s take the bulls first.
If you are bullish and you disagree with me, then why not reply with something like: "I know, isn’t it great?" Yet that is not what I got. I got laundry lists of why I was wrong. My take? It was because the bulls, in their hearts, know moves like this are unsustainable.
If you are bearish and you thought I meant it will end terribly, then I would go back to my default line about how all those analog charts seem to end in a 1929 crash. That doesn’t have to be.
Markets often rhyme but rarely repeat. Just because that move in the SOX feels unsustainable to me doesn’t mean I think it ends in a crash. As I explained last week, many — in fact most — of the stocks have taken long periods of rest along the way. They are over-extended and they are overbought and they are in need of a correction.
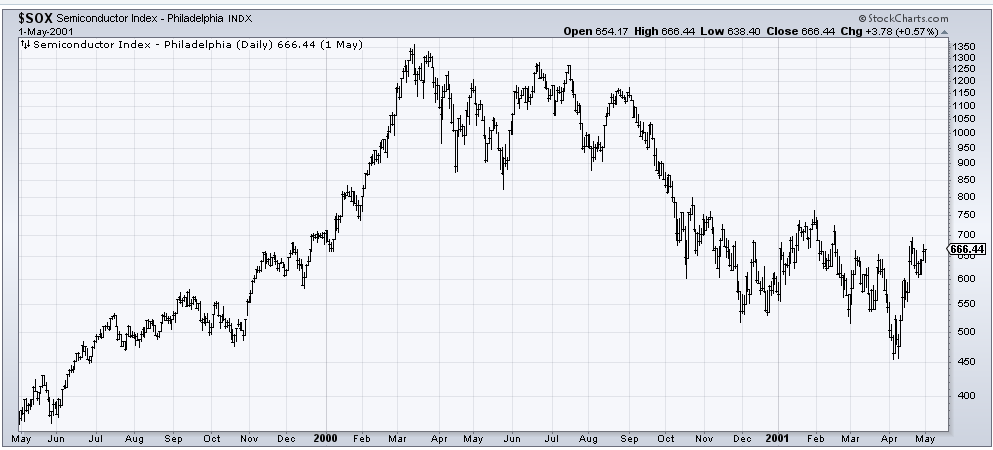
Take a look at 1999-2000. That peak in March gave way to a correction, it didn’t just fall apart. Look at that terrific rally in May 2000. Now, take another look: it couldn’t make a higher high. It tried again in July, same result, no higher high. Then it tried again in August, another lower high. It was breaking under the May low that led to this being a top.
My guess is that so few remember how long it took for the actual top to be put in (six months). They forget how it just looked like a correction, a dip to buy. And it was. Because unless/until there are lower highs and lower lows, we should still be talking about a correction, not a top.
I want to make one other comment about 1999:
It wasn’t so much that stocks went parabolic and that every IPO doubled or tripled on its first day of trading — for me, it was how many stocks languished. The drugs, staples, energy, materials, etc. just refused to participate. In the last two weeks, it is that — the refusal to participate — that has me most bothered. It is not glaring as it was in the late 1990s, when breadth was negative almost daily and the line went down while Nasdaq and the S&P went up. Right now you can see how breadth has stalled (blue line). You can see it is barely higher than it was when the S&P was 6900 last fall.
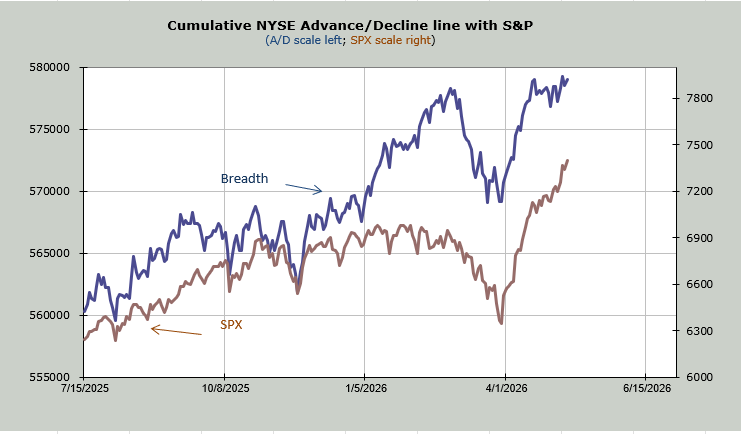
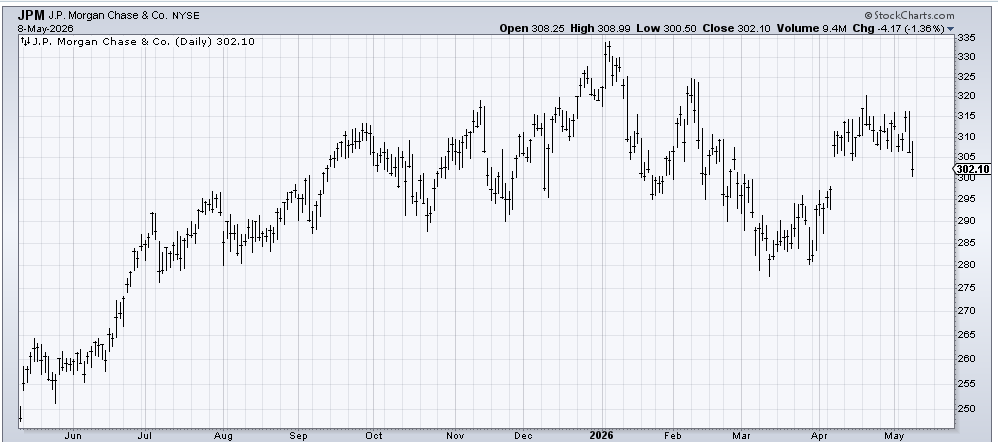
It hasn’t been weak enough to roll the McClellan Summation Index over yet. But when I see the Bank Index down 7% from the February high and 5% from the mid-April high, I fret. And when I see JP Morgan (JPM) on the verge of filling the gap from the first week of April, and a stock like that down on the year while INTC rallies 17% in a day, I fret.
And then I see the DSI for Nasdaq at 85 (the S&P is at 82, so there’s a bit of room there) and the VIX’s DSI as a teenager (19) and I know we are getting intermediate term overbought this week, I think we are headed to a correction or a bout of volatility.
New Ideas
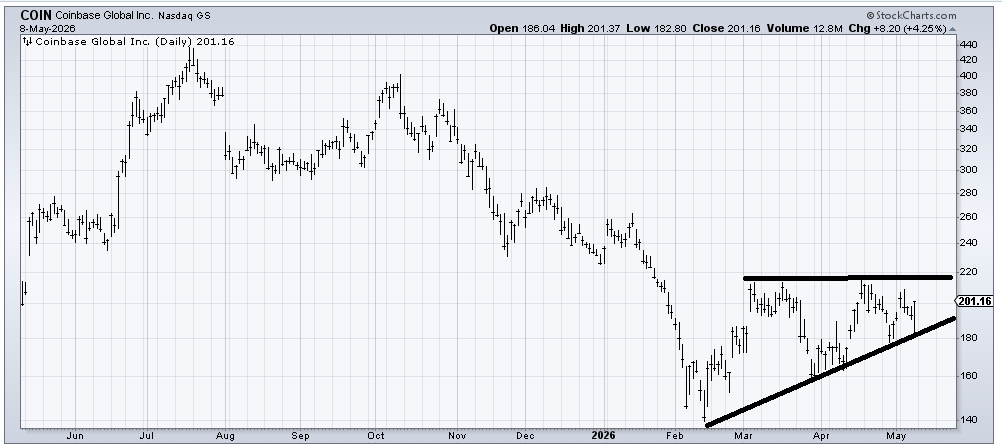
Someone asked me about Coinbase (COIN) a few weeks ago and I was quite wishy-washy in my view. I noted that I just couldn’t see the path forward. It has since gone down, up and down again. But Friday’s reversal off that uptrend line I would take as a positive. Now I’d like to see it get up and over that 220 zone. I obviously do not want to see it break the uptrend line.
Today’s Indicator
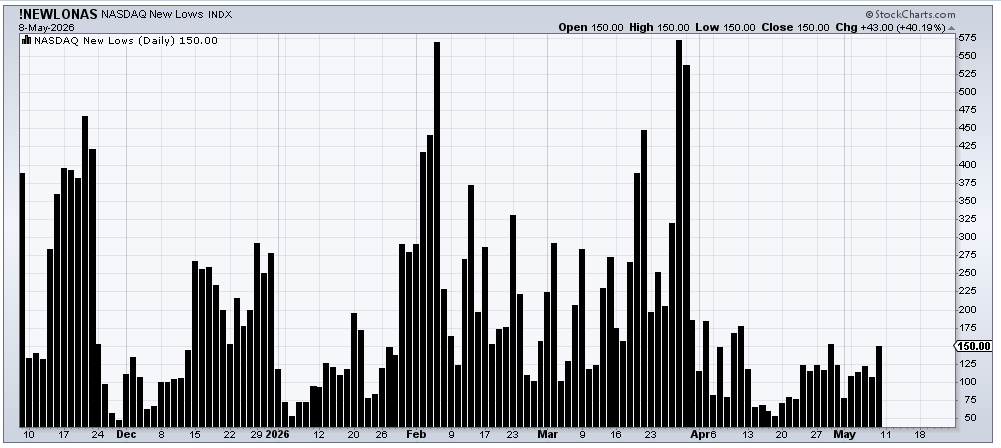
The number of stocks making new lows is creeping up on Nasdaq, now at 150.
Q&A/Reader’s Feedback
Helene welcomes your questions about Top Stocks and her charting strategy and techniques. Please send an email directly to Helene with your questions. However, please remember that TheStreet.com Top Stocks is not intended to provide personalized investment advice. Email Helene here.
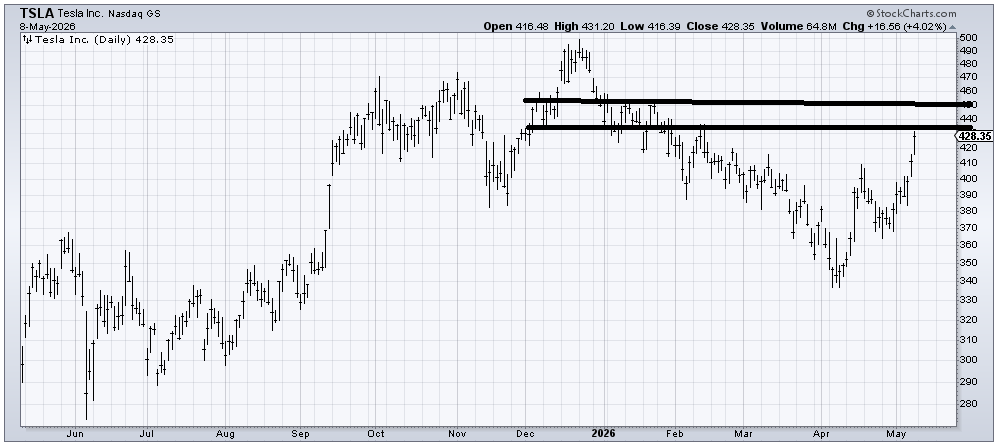
I recommended Tesla (TSLA) a few weeks ago when it got to that 380 area so it took a few weeks but it finally got going. It is now up against some resistance and is a little overbought but I suspect it gets into that 440-to-450-ish area short term. I don’t have a longer term target yet.
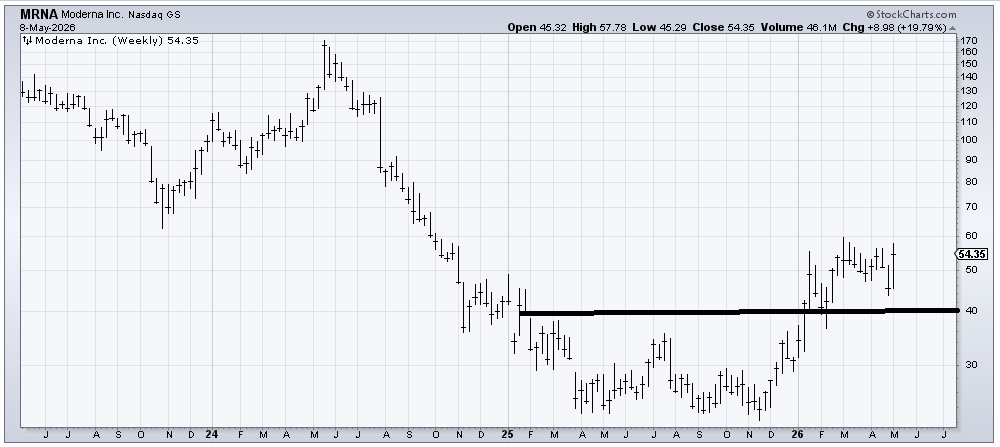
I am showing the three-year weekly chart of Moderna (MRNA) because I have called this a base for a while and it still is even though it hasn’t don’t a thing all year except trade back and forth between 40 and 60. I would consider over 60 a breakout. On a longer term chart, this remains a good look.
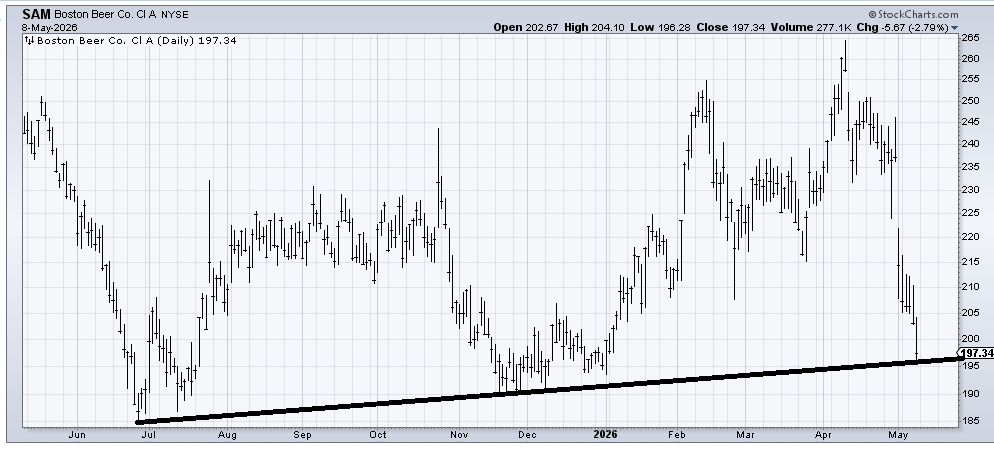
When we looked at Boston Beer (SAM) about a month ago I thought it needed a pullback but I liked the chart. I did not expect a full collapse as it has done. But here again, notice non-tech stocks are having a bad run. There is support in this 190 to 200 area and the stock is oversold enough to rally but that’s the best I can say now.
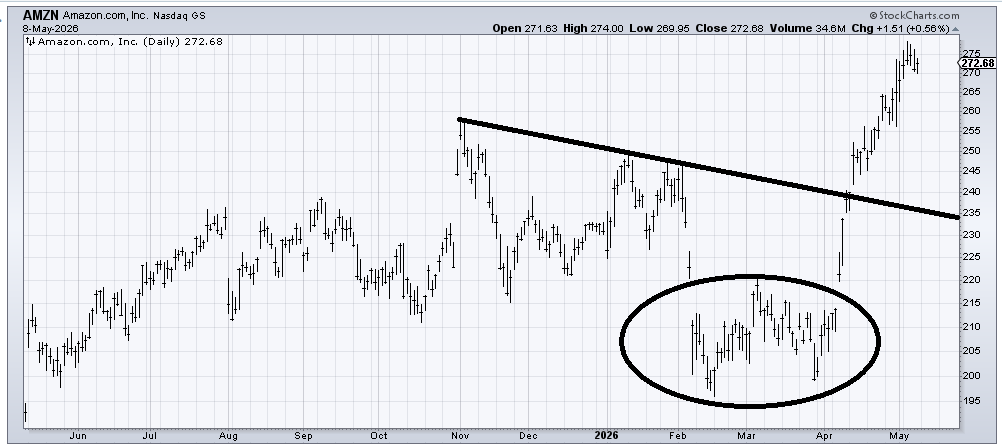
Amazon (AMZN) left a sort of island down there when it gapped up in April (circle) which is bullish. The chart is over-extended and needs a correction (250 to 260 would be a good spot). There is a measured target in the 280 to 290 area.
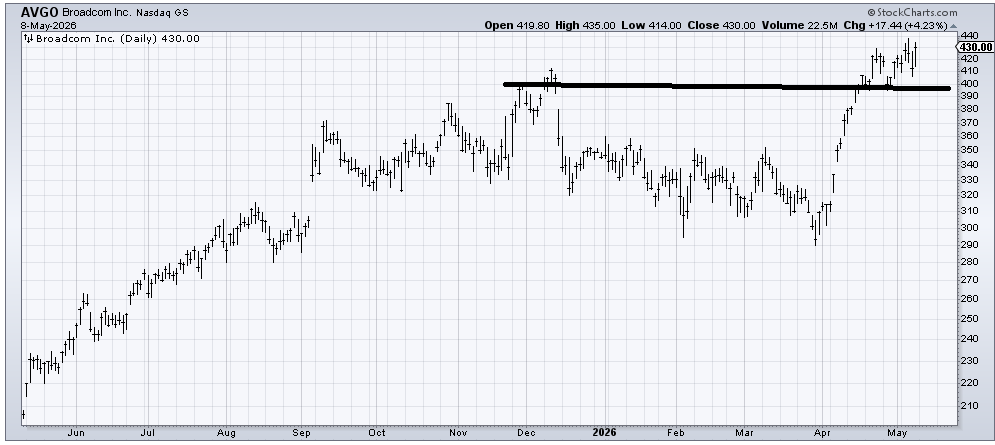
Broadcom (AVGO) is one of the three charts I said I was watching at the lows and as long as it held over 280 to 290 it would be okay. Here you can see it has not participated in the SOX run these last three weeks but as long as it holds over 380-ish (and that has some leeway) it seems to be digesting the move and not much more.
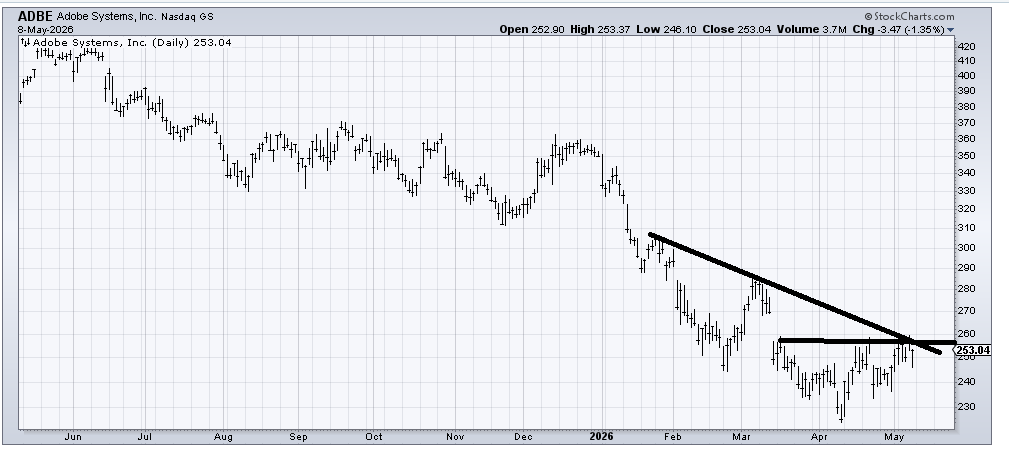
A few weeks ago I said I thought Adobe (ADBE) was trying to bottom but it hasn’t done a thing except maybe rally a few bucks. If it can get over 260 the next resistance is that gap fill at 270.
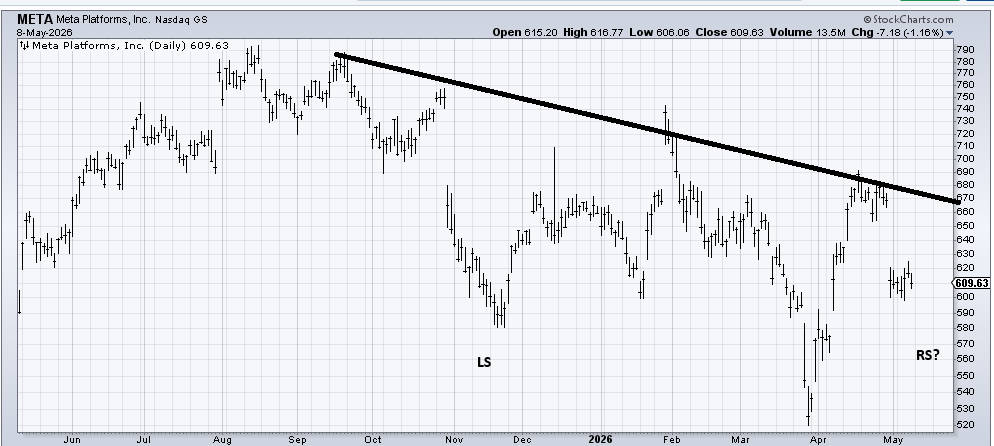
Meta (META) hasn’t made a new high in almost a year. I keep looking for it to form some sort of base and it doesn’t do it. Short term, it’s oversold but if the stock can trade back and forth between 575 and 675-ish for a few months, it might start to form the left shoulder of a head-and-shoulders bottom. I need to see it develop a bit more.