Getting Transported to Oversold
We'll look at some indicators to see just how oversold we are getting as well as some interesting things happening with the transports.
You've reached your free article limit
You've read 0 of 1 free Pro articles.
Last week I reviewed the upcoming oversold condition in the market. Not much has changed on that front.
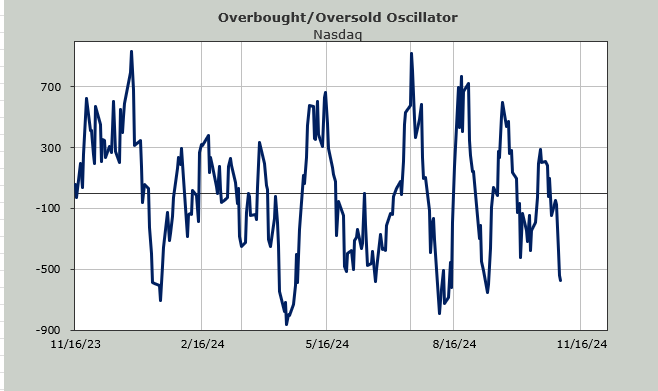
By that, I mean the Overbought/Oversold Oscillator is getting close to the April lows. The math behind it is okay. It is not the same as it was in April, though. In April the major indexes had been sliding for three weeks, and the last day or two were ‘whooshy’. We only began to get some downside in the indexes late last week, so that’s different. And that makes the math different.
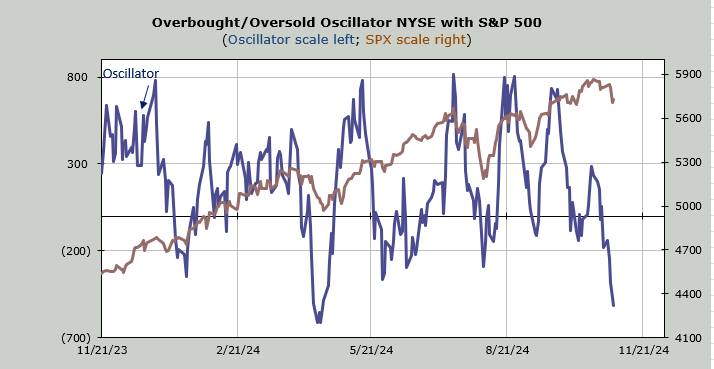
The math behind this ten-day moving average of net breadth shows two of the first three days of this week are big red numbers. In April we were staring at more than 6 or 7 such days. Here’s the table of what we are dropping.
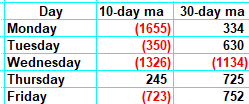
Notice how the 30-day moving average doesn’t show an oversold condition using the math in the table. On the chart it looks it, but not using the math behind it. In April the math showed a lot of red to be dropped.
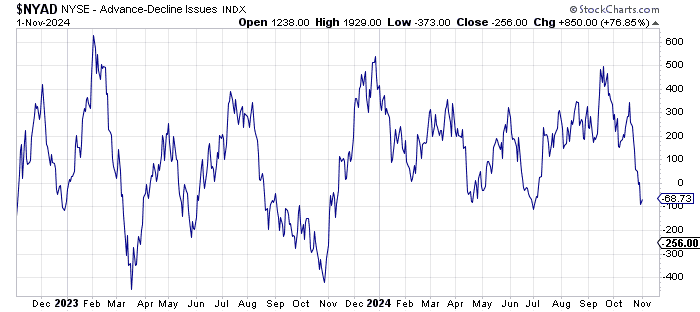
The other two short-term momentum indicators I watch, the Nasdaq Momentum Indicator and the ‘what if’ for the McClellan Summation Index, are both showing a bit more time and/or selling is needed. See Friday’s column for further details.
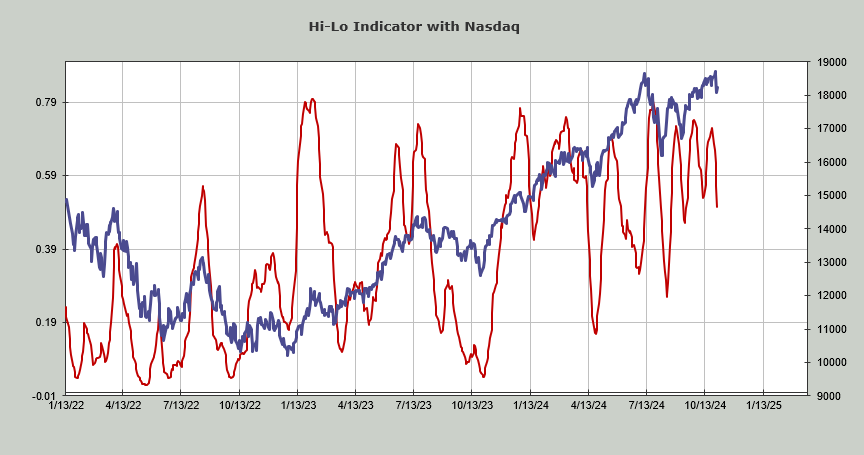
In April the Hi-Lo Indicator plunged to just under .19 making it oversold. The current reading is .51 so that too is a difference. It needs more time to get oversold.
In April the ten-day moving average of the put/call ratio started moving up from a higher level so it got to 1.05 in a hurry. Now the put/call ratio on Friday was 1.12 which is a big help in moving the moving average upward (notice it is now higher than it was in September) but there is still much room before it gets to that 1.05 area.
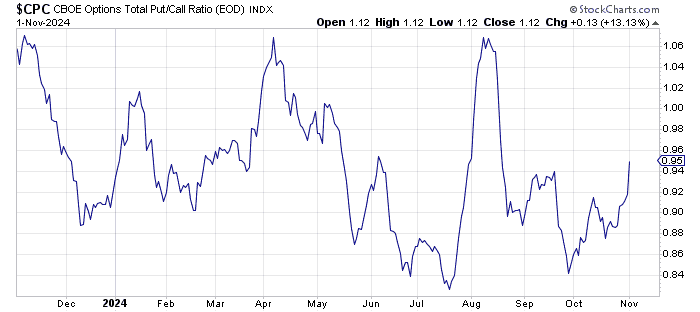
But the good news is, you can see from the indicators that there is finally movement in the direction of getting some of these intermediate-term indicators oversold.
I think it would be quite a bit better if we can get sentiment more bearish as we did in April, or heck, even early August saw a vast change in sentiment.
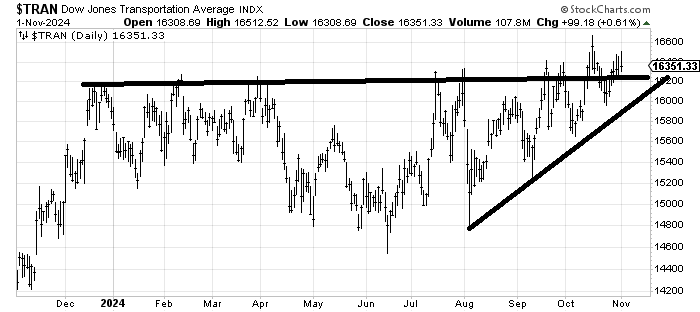
Now, there is something else I would like to highlight. It’s the Transports. For most of the year, I have railed that the Transports were lagging. They still are. But take a look at the last two weeks and notice that they are holding their own. I have been sucked into thinking they would break out before, so I must admit my view might be biased.
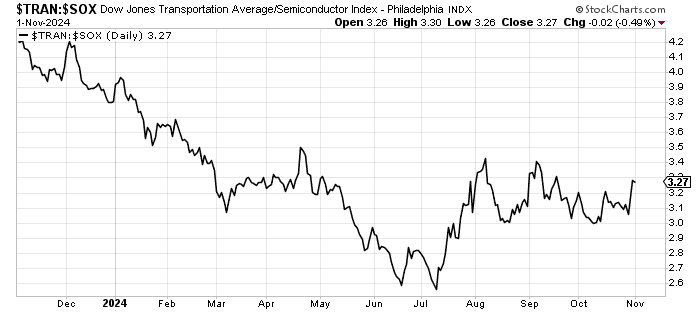
With that in mind I have a ratio chart that has caught my eye. It matches the Transports relative to the SOX. The Transports troughed against the SOX last summer in June/July. Maybe this is all they can do, but I have my eye on that 3.0 area and 3.4. Over 3.4 and I would have to say there’s something going on in terms of a shift toward the Transports. Under 3.0 and this will be just a blip in a continued downtrend. My guess is the ratio heads higher but as noted above, I have been sucked in before.