Factory Output Falls in Year’s First on Broad-Based Cooling
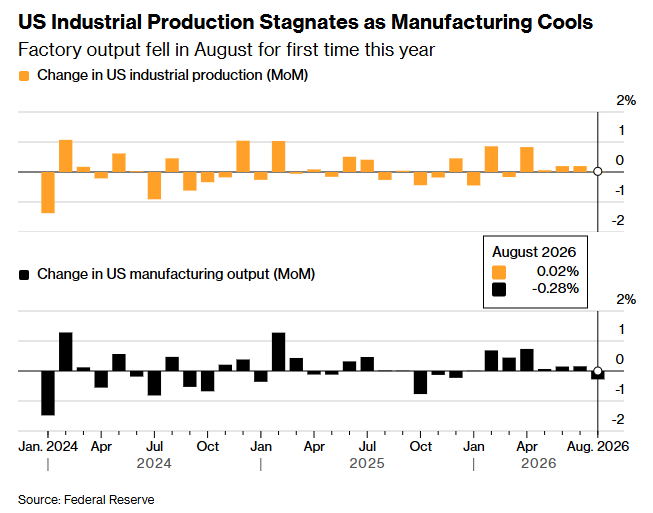
Manufacturing production slipped 0.3% in August — its first drop of the year and biggest since October 2025.
You've reached your free article limit
You've read 0 of 1 free Pro articles.

US Industrial Production (M/M) Aug: 0.0% (est +0.3%; prev +0.2%)
- Manufacturing (SIC) Production: -0.3% (est +0.3%; prev +0.2%)
- Capacity Utilization: 76.3% (est 76.4%; prev 76.3%)
Although industrial production accounts for only around 12-15% of total gross domestic product, it is considered an important macroeconomic indicator measuring output from the manufacturing (~75% of industrial production), mining (~10%), and utility (~15%) industries, and can aid in forecasting structural changes in the economy, business cycle inflection points and inflationary trends. Note industrial production is based on value so prices paid impact these figures. All figures m/m unless otherwise noted.
Executive Summary:
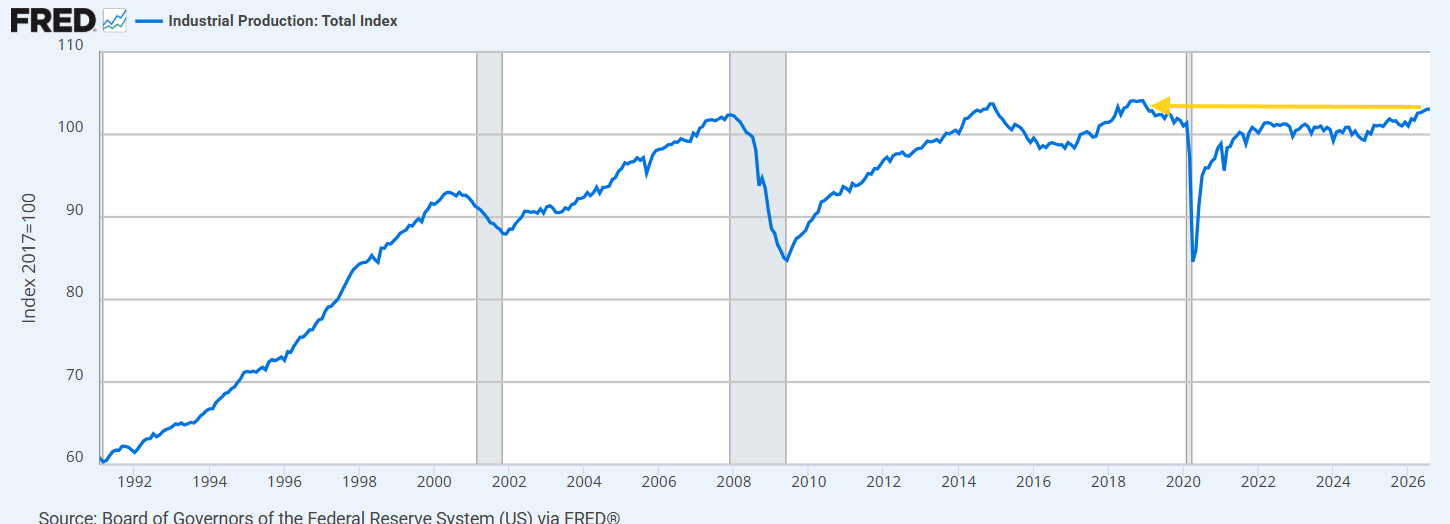
- August industrial production was unchanged (+0.02%) from July (m/m) the weakest since March, although the fifth straight positive month, versus expectations for a +0.3% gain, after +0.20% in July. The three-month average is a relatively weak +0.14%. Still, total industrial production nudged to its highest level since January 2019.
- The flat headline masked the first stumble in factory output this year: manufacturing fell -0.3% (-0.28%), its first decline of the year and biggest monthly drop since October 2025, ending seven straight monthly gains, as durable goods declined -0.5% and business equipment cooled. Excluding autos, manufacturing still dropped -0.2% as several high-tech components saw contractions.
- A +1.8% jump in utilities — the most since December 2025 — helped keep the headline in slightly positive territory.
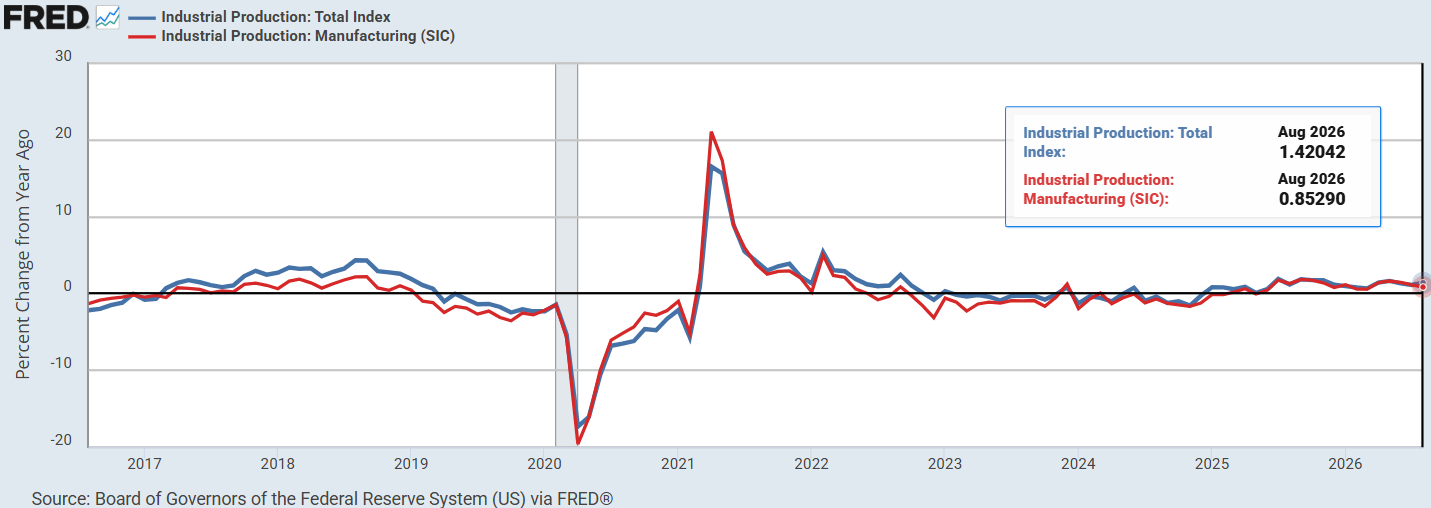
- Year-over-year, total industrial production is +1.42% and manufacturing +0.85%, both still negative in real terms and neither sustainably above 2% since 2022.
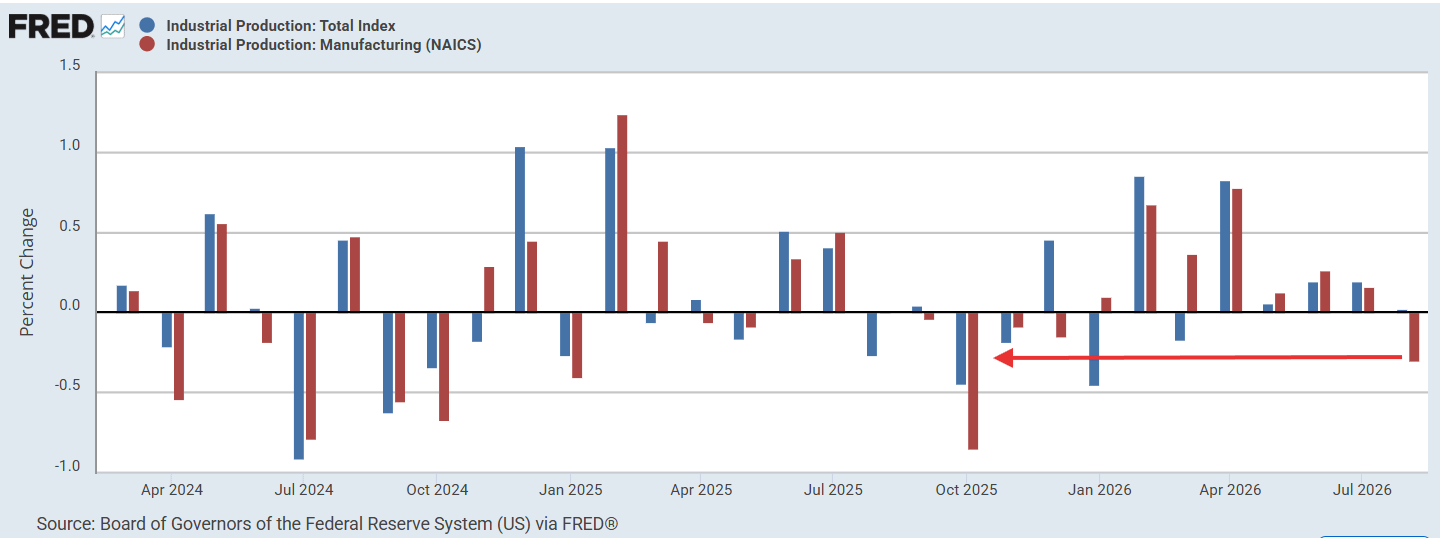
August industrial production (blue) was unchanged (+0.02%) from July (m/m), the weakest since March, although the fifth straight positive month, versus expectations for a +0.3% gain, after +0.20% in June and July, bringing the three-month average to +0.14%.
Manufacturing (red, ~75% of industrial production) though fell -0.3% (-0.28%), its first decline of the year and the biggest monthly drop since October 2025, after increasing for seven consecutive months. The drop was broad: durable manufacturing declined -0.5% “with broad-based declines across categories,” while nondurable manufacturing was unchanged. Notably, even excluding motor vehicles and parts, manufacturing output dropped -0.2%, so this wasn’t entirely an auto story.
Total industrial production still edged up to its highest level since January 2019.
Looking from a year earlier, headline industrial production is +1.42% and manufacturing +0.85%, both roughly steady versus July but negative in real (inflation-adjusted) terms, with neither sustainably above 2% (in nominal terms) since 2022.
Among industry groups, the weakness was broad-based, with the largest declines in furniture products (-1.4%), aerospace equipment (-1.2%), and motor vehicles and parts (-1.2%, and -0.95% year-over-year). Computer and electronic products fell -0.5% (though still +8.69% year-over-year), while machinery, apparel and textiles increased.
Looking at industrial production from another angle “market groups” (product-use classifications), “the major market groups posted mixed results in August.” Consumer goods edged up +0.1% (+0.11%), as a +0.27% rise in nondurable consumer goods offset a -0.46% decline in durable consumer goods. Consumer goods remain -1.11% year-over-year.
Business equipment spending fell -0.49%, the largest decline since October 2025, after July’s +1.02%, though it remains +7.10% year-over-year.
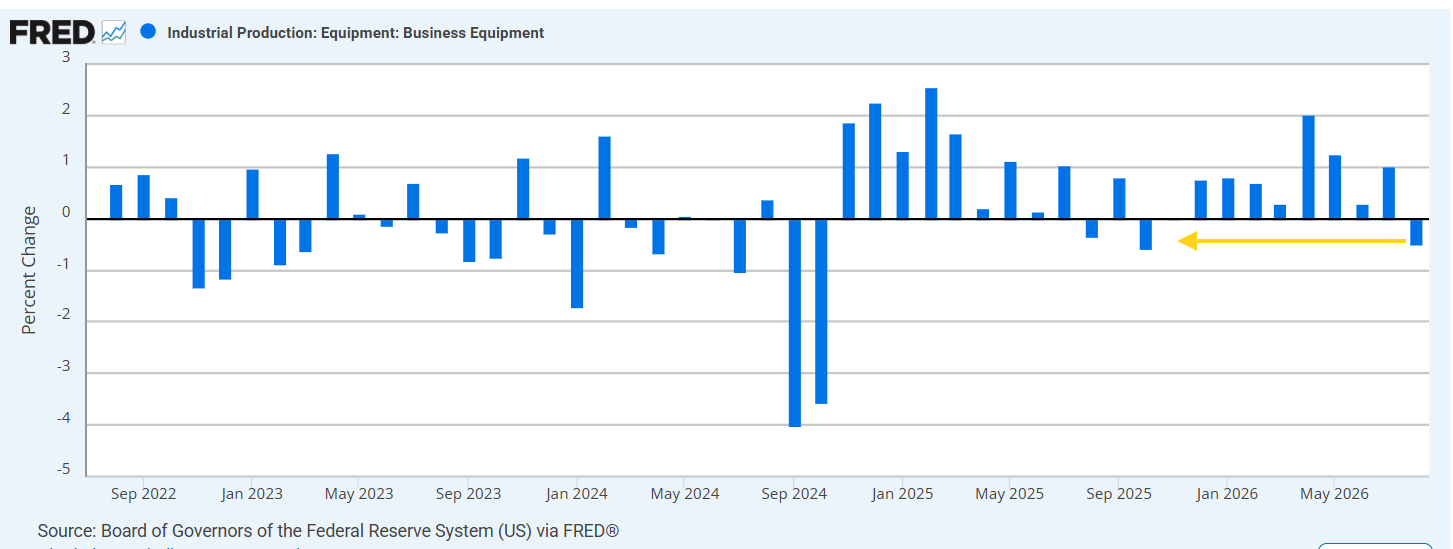
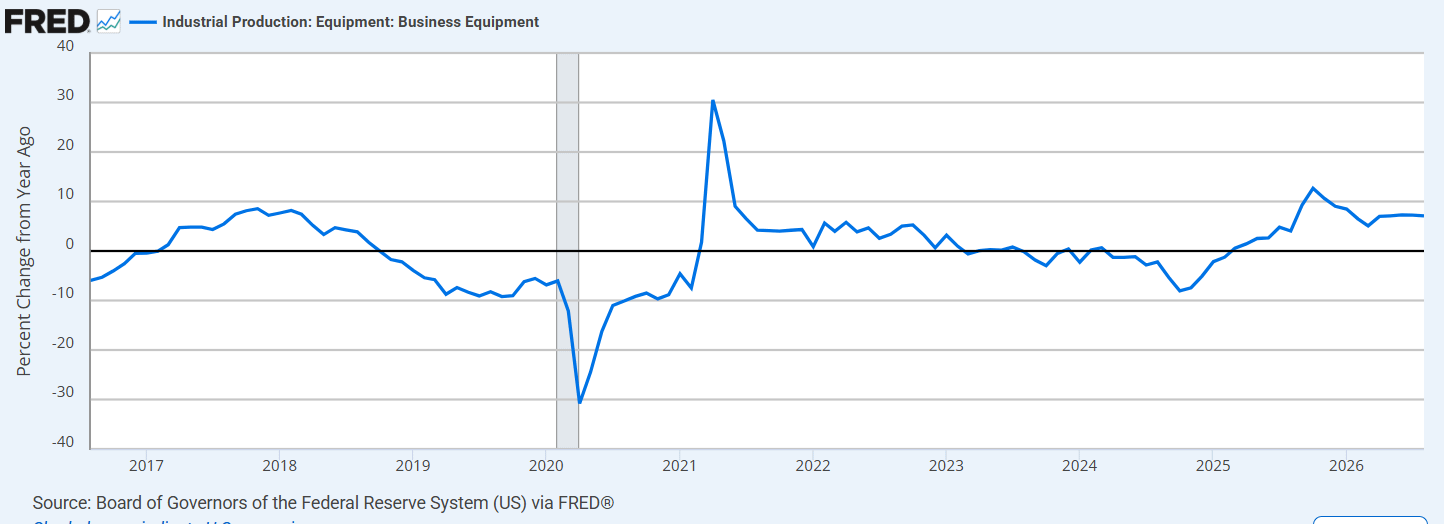
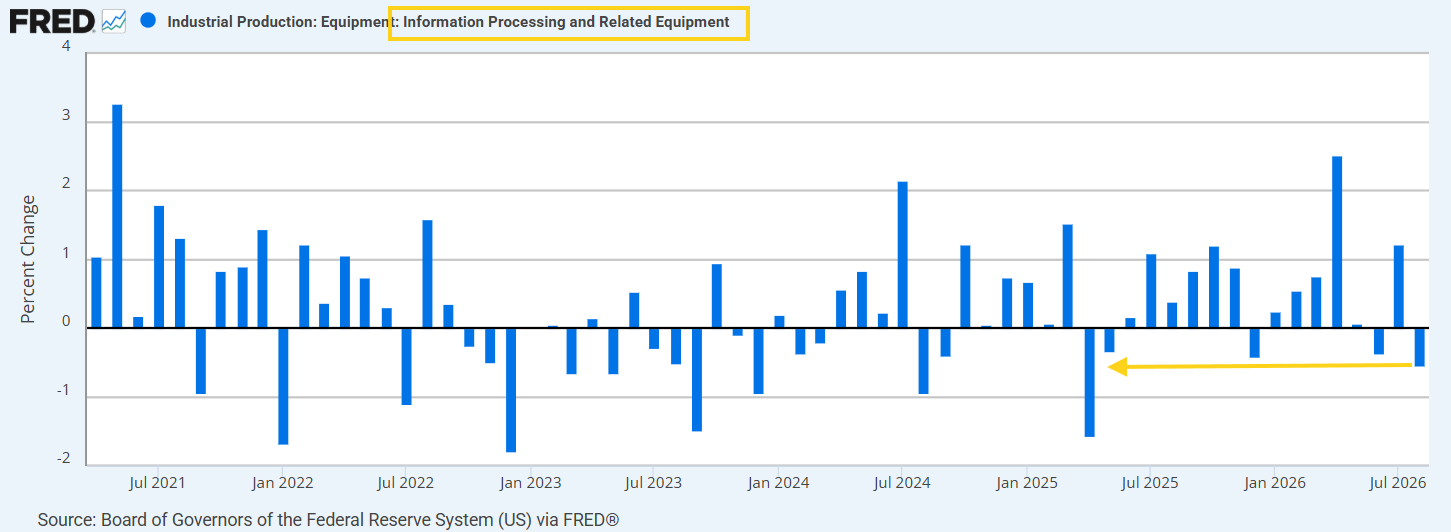
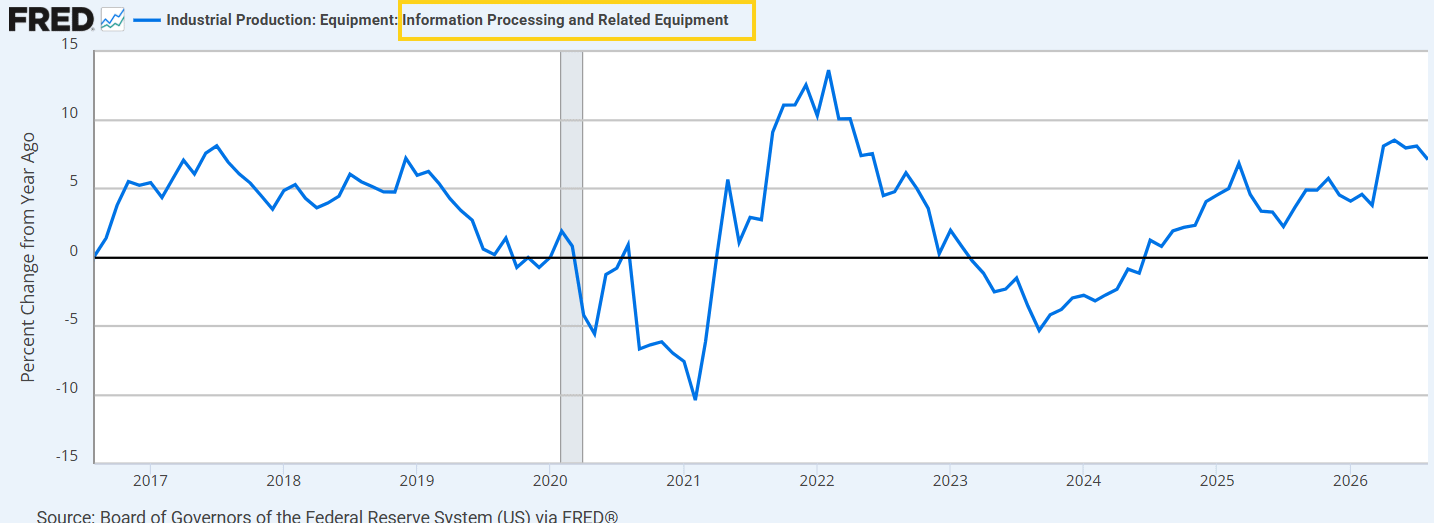
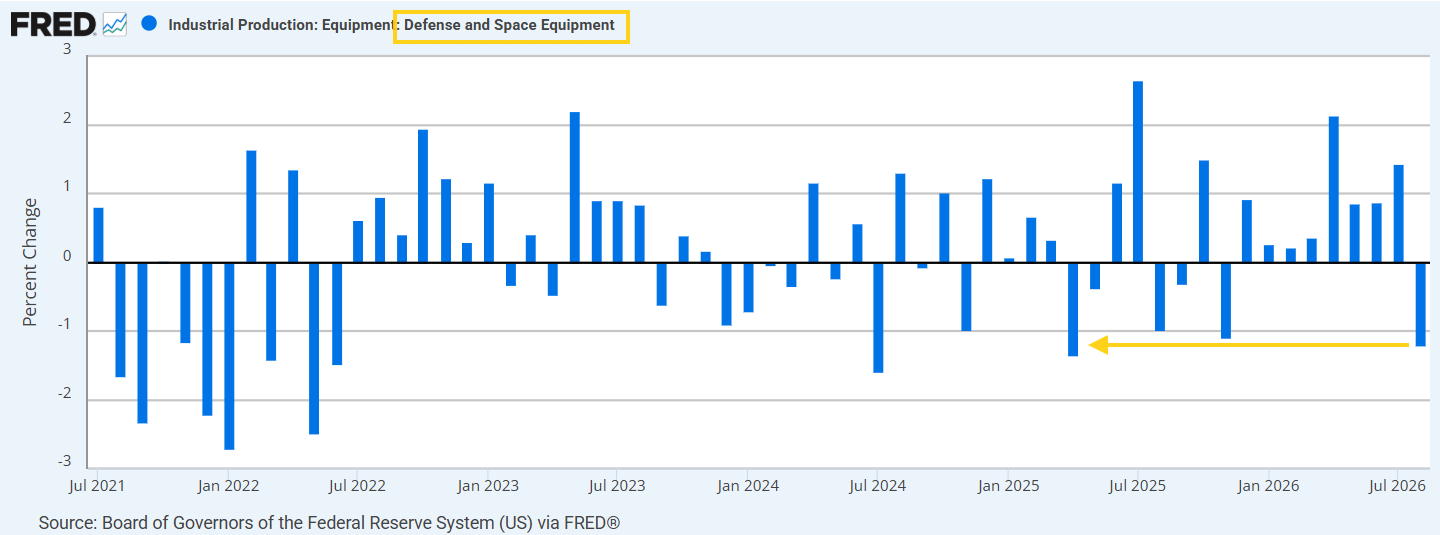
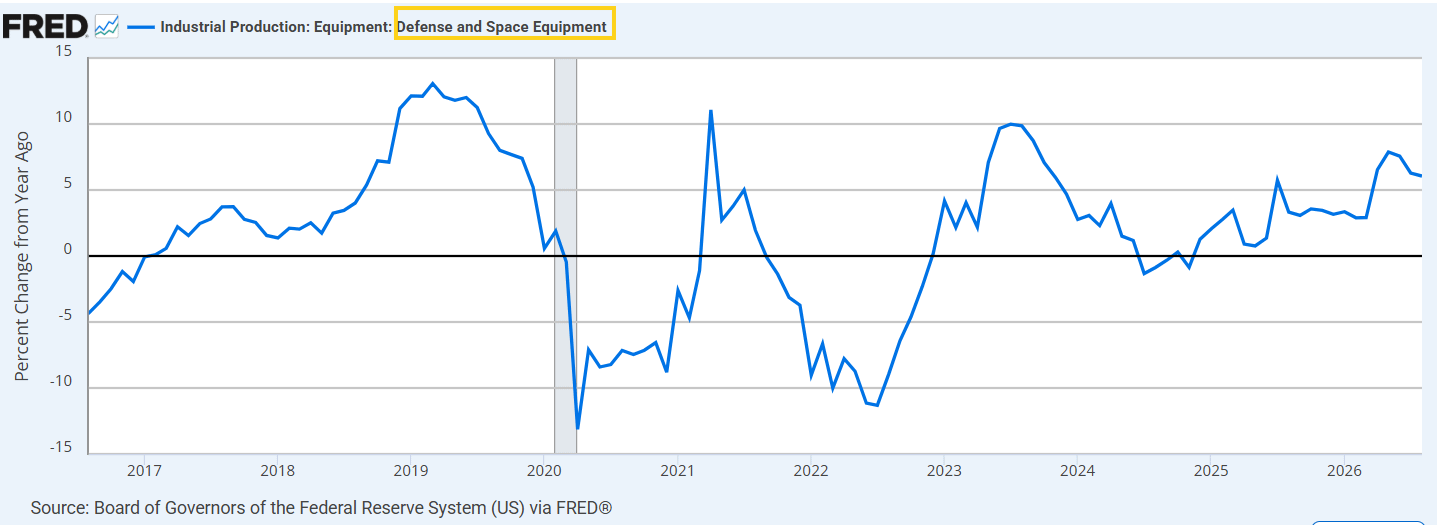
Declines across prior leaders defense and space equipment (-1.21%) and information processing (-0.54%) — both the largest since April 2025 — weighed, as did transit (-0.60%) and industrial and other equipment (-0.41%). Still, defense and space is +6.05% year-over-year and information processing +7.10% (charts).
Non-industrial supplies (intermediate goods that leave the industrial sector and are used as inputs by non-industrial sectors) fell -0.21%, with construction supplies down -0.73% while business supplies ticked up +0.09%.
Materials rose +0.22%, “driven by a 0.7 percent increase in the output of energy materials.”
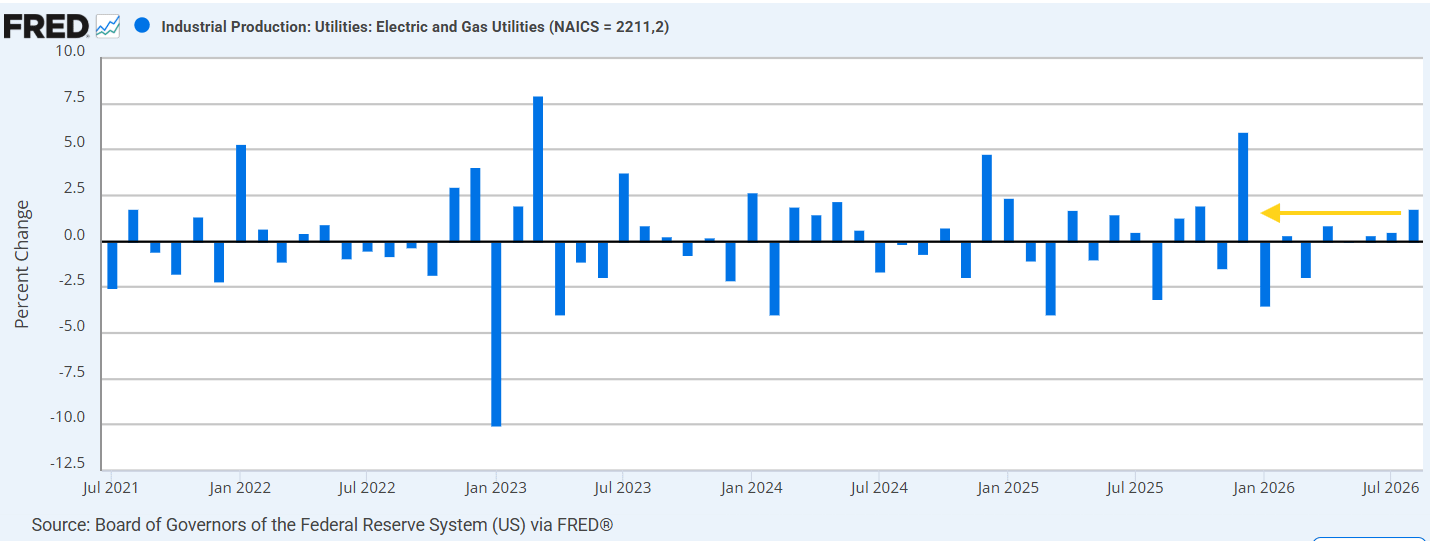
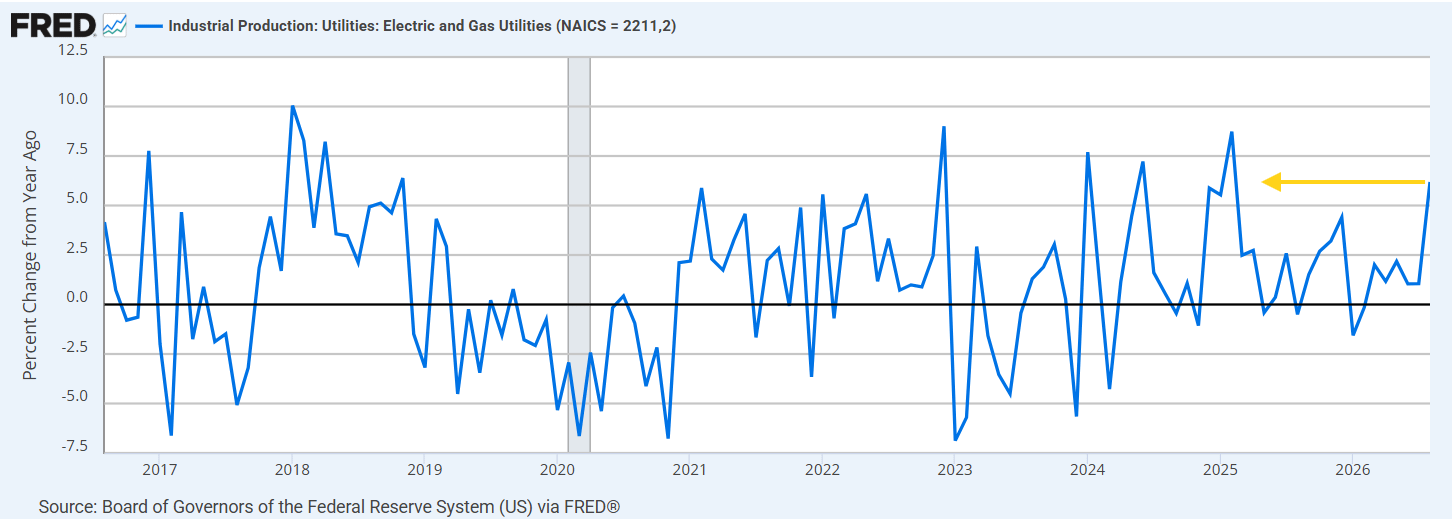
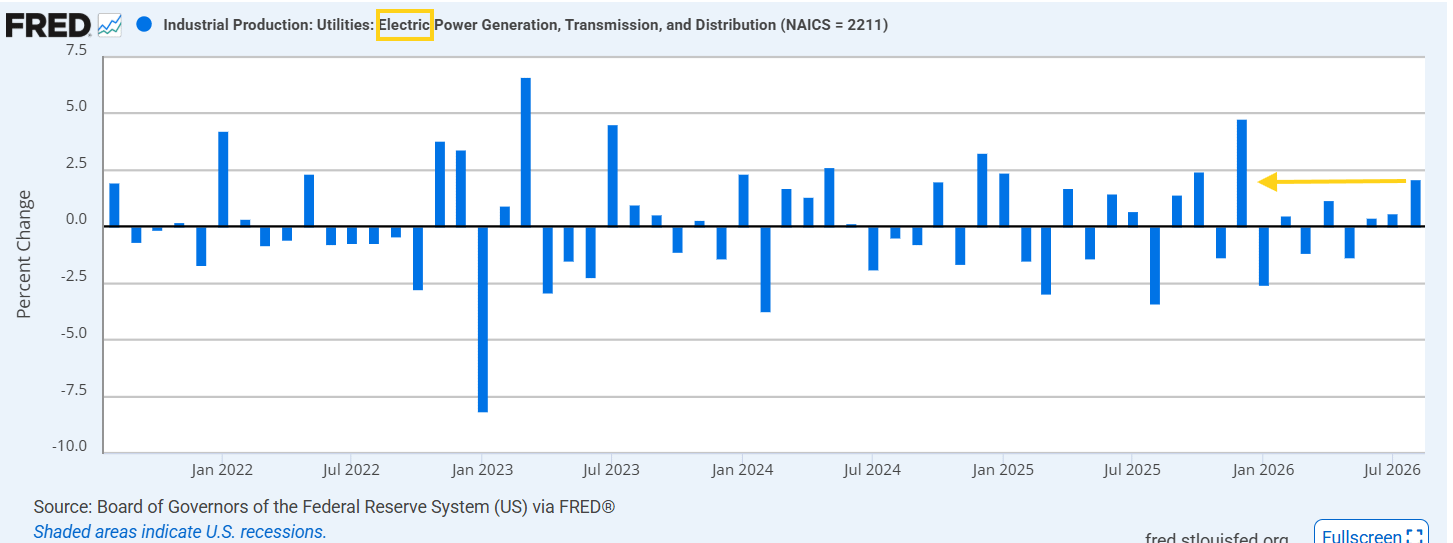
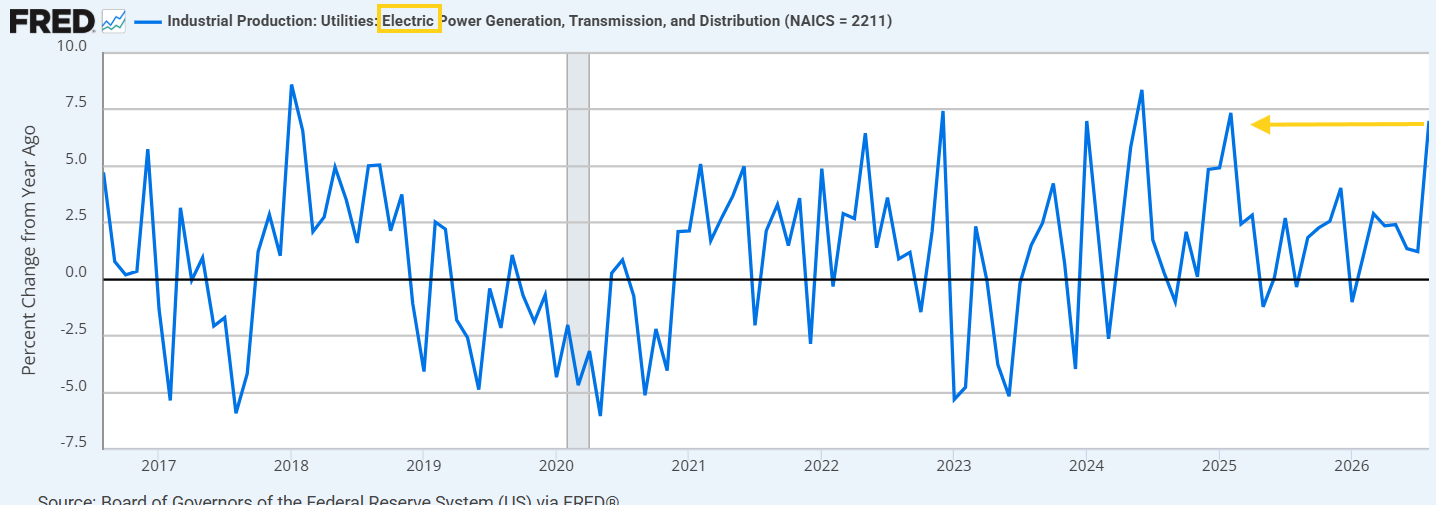
Utility production jumped +1.78%, the most since December 2025, “with an increase in the index for electric utilities more than offsetting a decrease in the index for natural gas utilities” — electric rose +2.1%, the most this year, while natural gas fell -0.5%. Utilities are now +6.19% year-over-year, the most since February 2025, and electric +7.00%, also the most since February 2025.
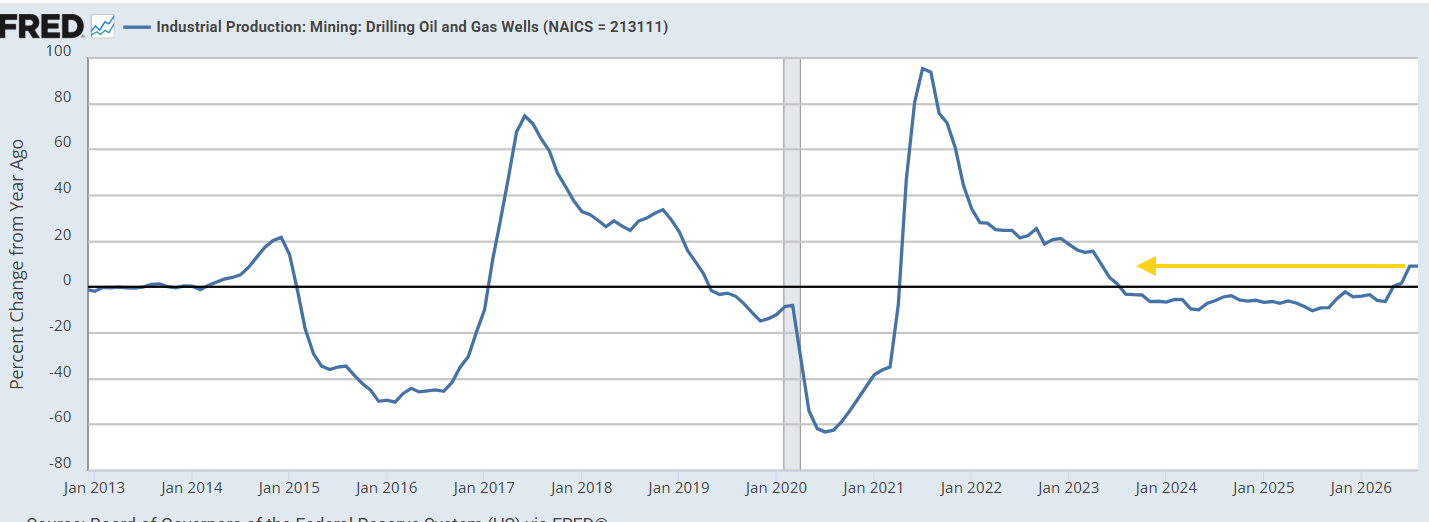
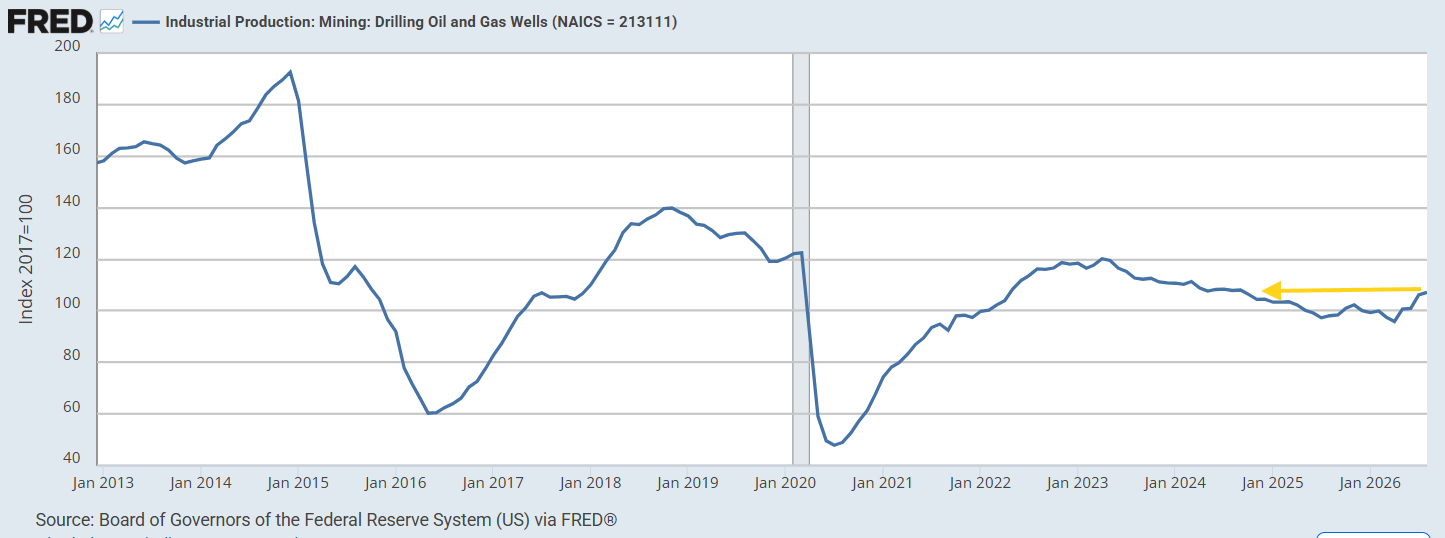
Mining (which includes oil and gas exploration) edged up +0.14% and is +0.26% year-over-year. Oil and gas well drilling rose +0.87% and is +9.22% year-over-year, with output the highest since September 2024.
While overall industrial production is at its highest since January 2019, total industrial capacity remains at an all-time high (so production has lagged capacity). In that regard, capacity utilization (blue) was unchanged at 76.3%, “a rate that is 3.1 percentage points below its long-run (1972–2025) average.”
Capacity utilization at factories (red, manufacturing) fell to a five-month low of 75.7%, “a rate that is 2.5 percentage points below its long-run (1972–2025) average.”
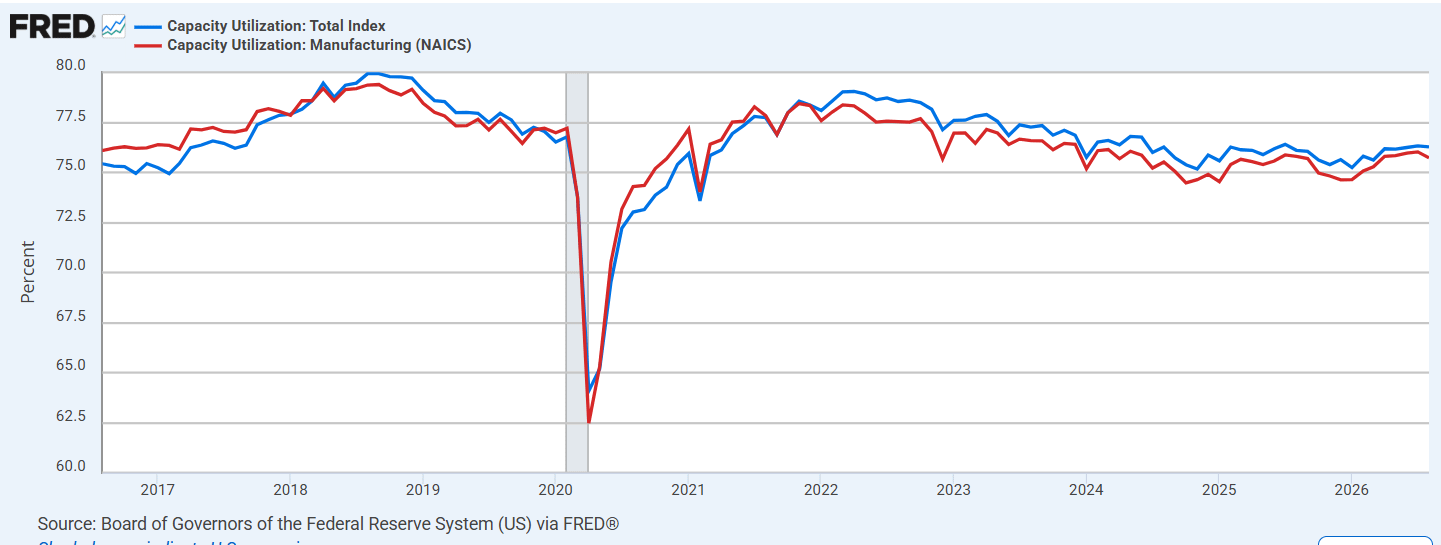
“The operating rate for mining rose 0.1 percentage point to 86.3 percent in August, and the operating rate for utilities increased 1.1 percentage points to 71.3 percent. The rate for mining was 1.1 percentage points above its long-run average, while the rate for utilities remained substantially below its long-run average.”
Analyst Reaction
- From Goldman Sachs: Goldman characterized the manufacturing softness as broad-based across industries and highlighted that production in high-technology industries — semiconductors, computers and communications equipment — was unchanged on the month but is up 12.5% over the past year. The stronger-than-expected utilities component, which feeds the consumption estimate in the GDP accounts, led Goldman to raise its third-quarter GDP tracking estimate by 0.1 percentage point to +3.3% (quarter-over-quarter annualized), even as the capex-sensitive business equipment component came in softer. Goldman also noted that most manufacturing industries are operating well below their maximum potential output, with only a few — notably electrical equipment and machinery, likely reflecting AI-related demand — nearing the peak capacity utilization rates of recent business cycles.
- Per Bloomberg, the report “represents a pause in the upswing in manufacturing this year,” with producers “facing higher costs for oil and other materials as well as supply-chain disruptions tied to wars in the Middle East and Ukraine.”
- “The broad-based decline in manufacturing output in August suggests the factory sector may be on a weaker footing than we had previously thought, particularly as this does not capture the latest rise in oil prices,” said Thomas Ryan at Capital Economics. “But with the timelier surveys still largely positive, it would be premature to sound the alarm just yet.” (BBG)
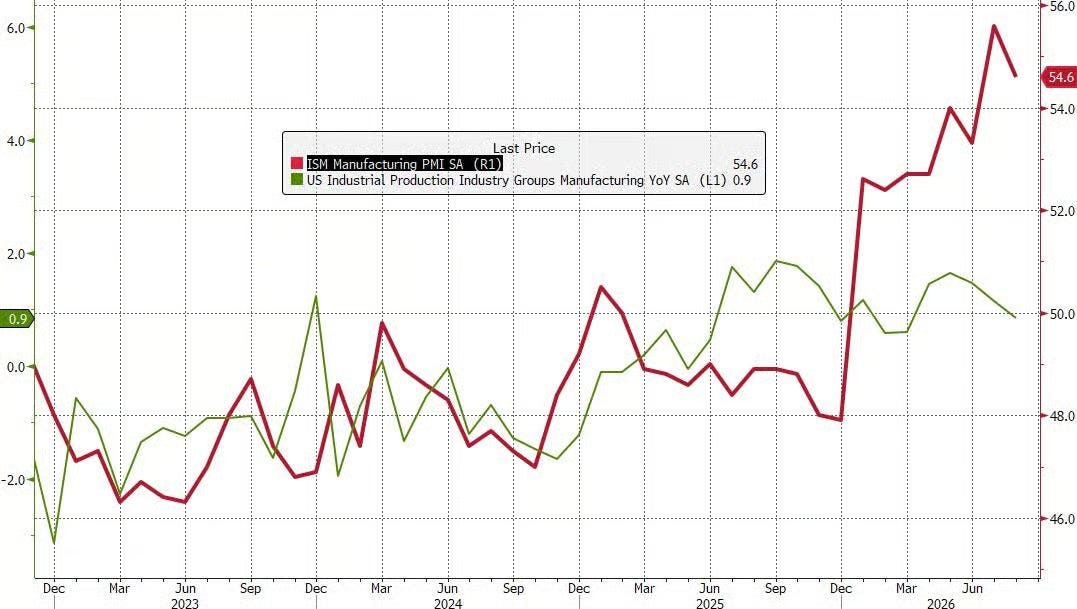
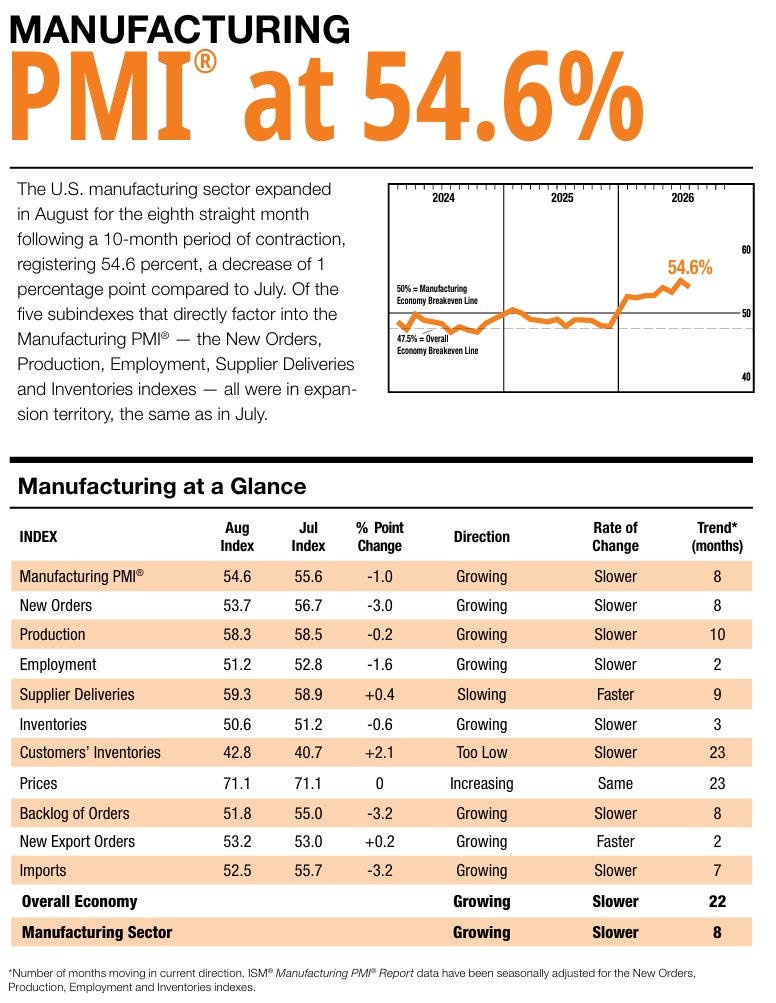
- ZeroHedge noted August’s pullback sits oddly against the ISM manufacturing survey data, which remains solidly in expansion territory.
Source: Federal Reserve G.17
