Dow Snaps a 5-Day Slide—But the Market’s 'Breadth Problem' Isn’t Fixed
Thursday’s surge felt like relief, not resolution: breadth is still diverging and key indicators haven’t flipped bullish yet.
You've reached your free article limit
You've read 0 of 1 free Pro articles.

I guess five straight down days for the Dow was enough. It was also seven straight red days for the equal-weight S&P. We saw that in the Overbought/Oversold Oscillator, having plunged from overbought to under the zero line so quickly. It did have a bit of the feel of ‘end of the month’ though.
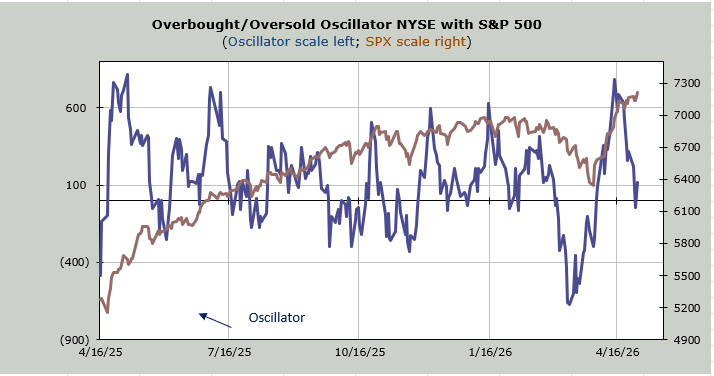
But was the rally enough to change the indicators? It was not. It will need follow-through and some better statistics to do that.
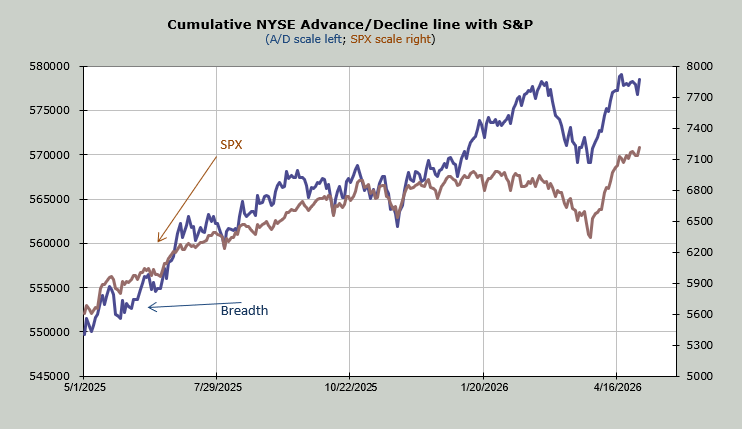
Let’s start with breadth. We know breadth had been lumpy this last week. I showed you the chart of breadth with the S&P and how they were diverging. They are still diverging, even after Thursday’s big rally. So we put that on the watch list: can breadth make a new high?
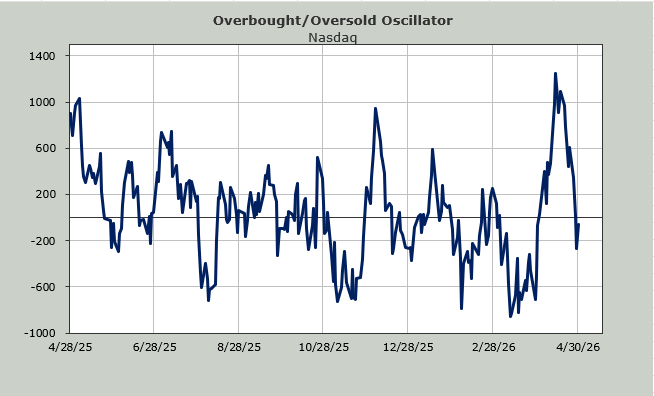
The McClellan Summation Index is flat. So, it needs a day or two of better—positive—breadth to renew its uptrend. Nasdaq’s Summation Index needs approximately 1.5 billion shares of up minus down volume to halt its minor downtrend and a bit more than that to renew the uptrend.
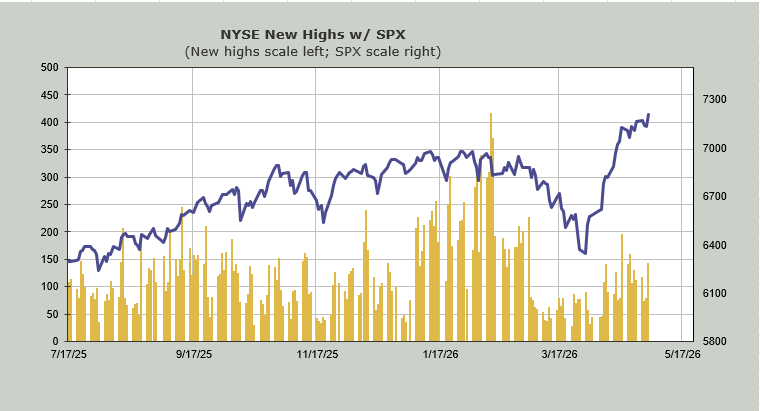
The number of stocks making new highs is still lagging. I suppose we will complement the NYSE if it can get to 200 new highs because that would be more than we had two weeks ago, but the real number is 400+, which was achieved in February. Right now, that seems far away.
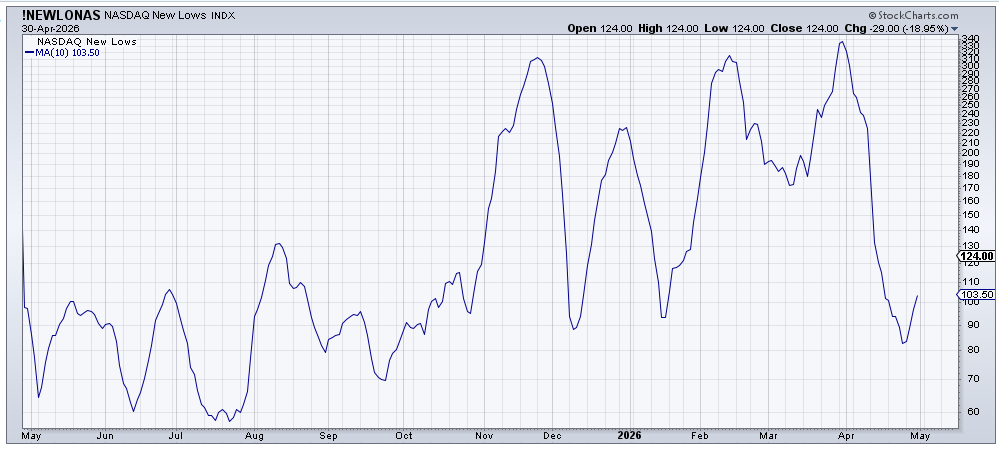
At least Nasdaq saw the new lows stop expanding on Thursday. We can see the ten-day moving average of new lows on Nasdaq has begun to rise. Bulls would like to see that peak and head down. Quickly.
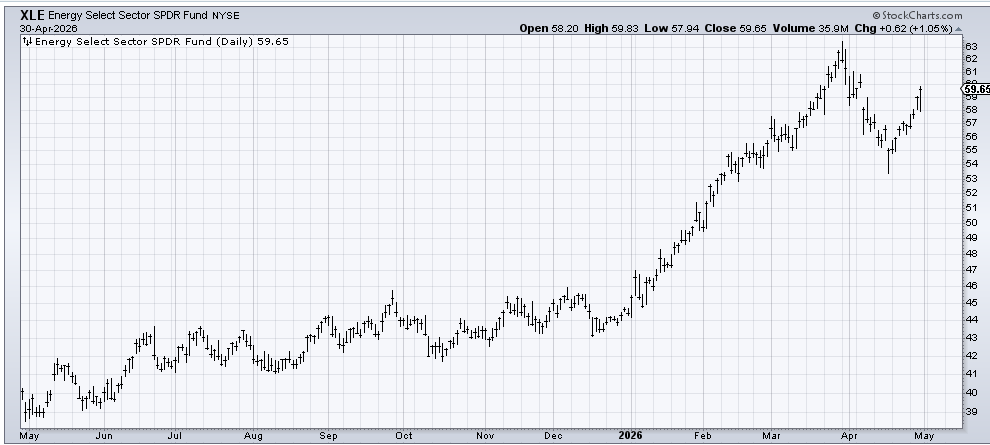
I do want to note that one reason I believe the new highs have lagged is because, despite the recent run in oil, the commodity, many of the energy stocks have not made new highs. XLE, an ETF to be long energy, is still about five percent below its peak.
Here is where I should note that the Daily Sentiment Index (DSI) for oil is at 83. But the DSI for gasoline is at 85. My rule is 85 and over, and we’ve got a yellow flashing light. Over 90, and that light turns to red. So I consider gasoline flashing yellow now.
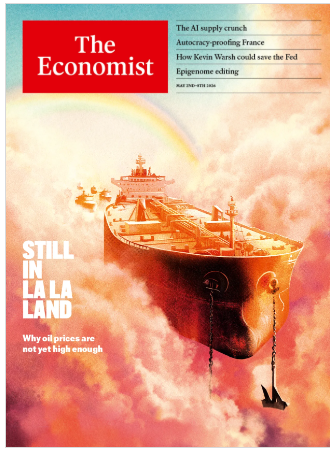
And if you want some anecdotal evidence—well, that is if magazine covers still matter---the Economist put oil on the cover with quite a picture. In case you can’t read the small print, it says: Why oil prices are not yet high enough.
Finally, the DSI for both Nasdaq and the S&P are now at 79, so if the rally continues, then by midweek I’d expect they too will be at that mid 80s (flashing yellow) level. Hope for a down day on Friday so that number calms down, too.
Related: Amazon Price Target as In-House Chip Business Hits $20 Billion
