As We Near Intermediate Term Overbought, Here's What to Watch
While the market hits new highs, not all stocks are following along.
You've reached your free article limit
You've read 0 of 1 free Pro articles.
The Market
You could sense the giddiness leak from the market over the last week. I mean, when the majority of stocks are heading down, it doesn’t lend itself to giddy, does it? As I noted, the Investors’ Intelligence bulls ticked up a mere point to 50% this week.
The AAII folks, who are more like day traders, saw the bulls come down eight points!
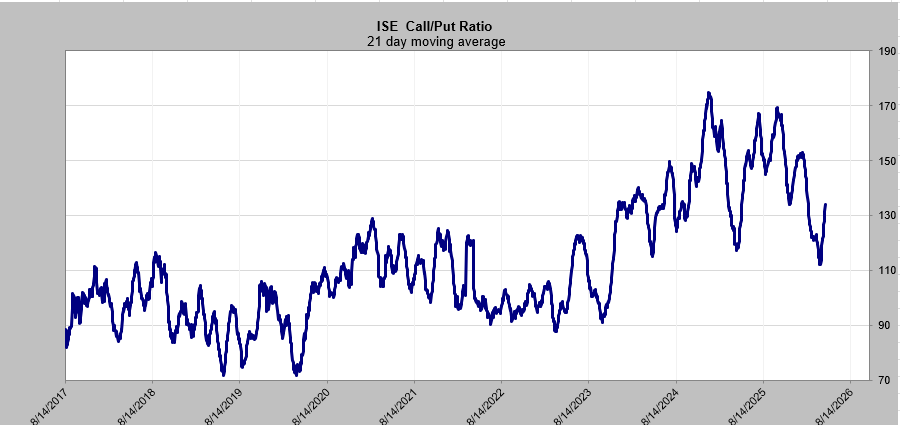
But days like today bring that bullishness back into the mix. The put/call ratio was .79 which is the first reading under .80 in a week. The DSI is now 79. The ISE call/put ratio’s 21-day moving average is now 1.34. Recall, I expect that will be near a peak around mid-month. The chart is below.
But were the new highs impressive? No, they were not. They are still under the peak readings.
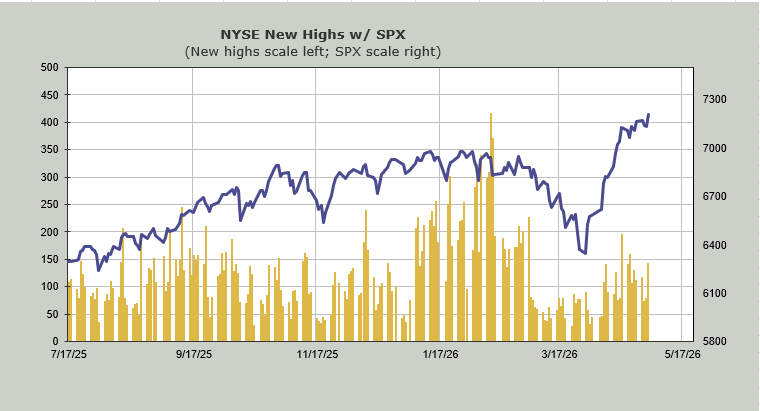
Breadth was good. But it was not good enough to turn the McClellan Summation Index back up. We need another positive breadth day for that. Overall breadth did not make a new high either. And upside volume was 75%. It felt a bit like a little oversold and the end of the month converging.
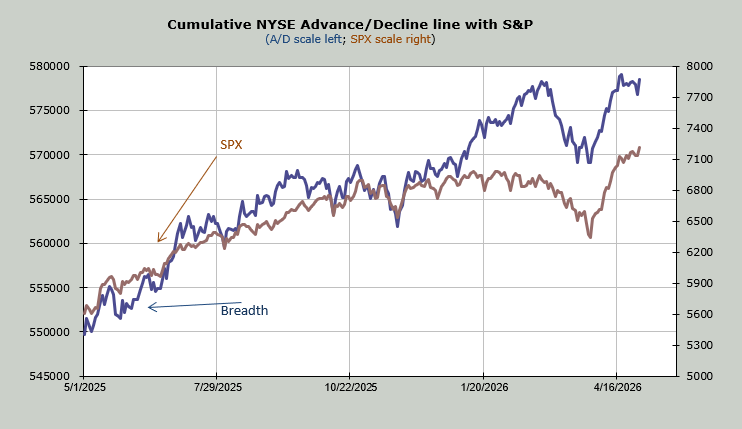
But this is where we start paying close attention. Over the next week or two, I expect the intermediate-term indicators to get overbought. If the new highs are still faltering, that would be a negative. If the Summation Index cannot get back on the upside track, that would be a negative. If sentiment moves from knocking on the door to absolutely giddy, that would be a negative.
There are two sentiment indicators worth pointing out. The DSI for oil is 83, so it is knocking on the door, once again. But gasoline is at 85. My rule of thumb is over 85, and we have a yellow flashing light. Over 90 and it’s a red light.
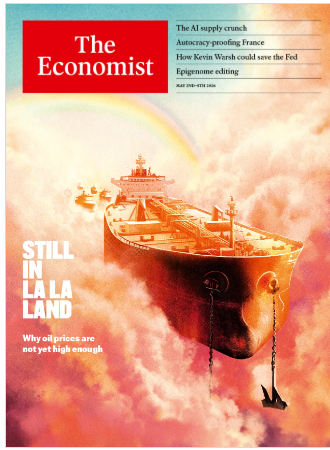
I bring this up because, despite higher oil prices, the place to be has been OIH (reminder: my pick has been Halliburton (HAL) ), not XLE. XLE is still well below the peak we saw a few weeks ago. That’s a divergence. And then there is the Economist Magazine with this picture on the cover. In case you can’t read the small print, it says,: Why oil prices are not yet high enough.
Magazine covers may not be what they used to be, but with that DSI for gasoline at 85, it is probably a good idea to take some of the HAL off the table.
And just a final note that the DSI for Bonds is 25, so I expect if we get a move in bonds that brings about hysteria in the next week or so, that DSI is likely to be a teenager.
New Ideas
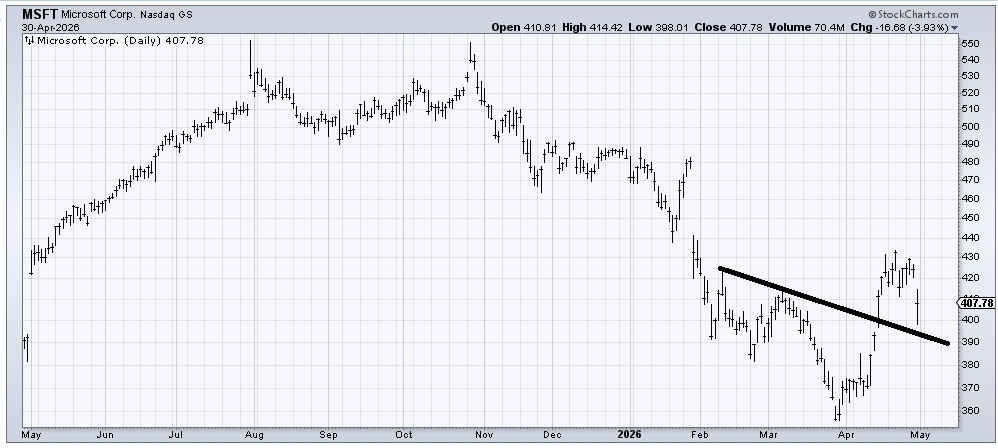
I am not a fan of buying stocks that gap down. I like them to round under, or test, but I was asked about Microsoft (MSFT) and if it was buyable into this pullback after a great run. I would like to see it settle down in the coming days, but I am of the mind that we see a bounce from that line, call it 390-400.
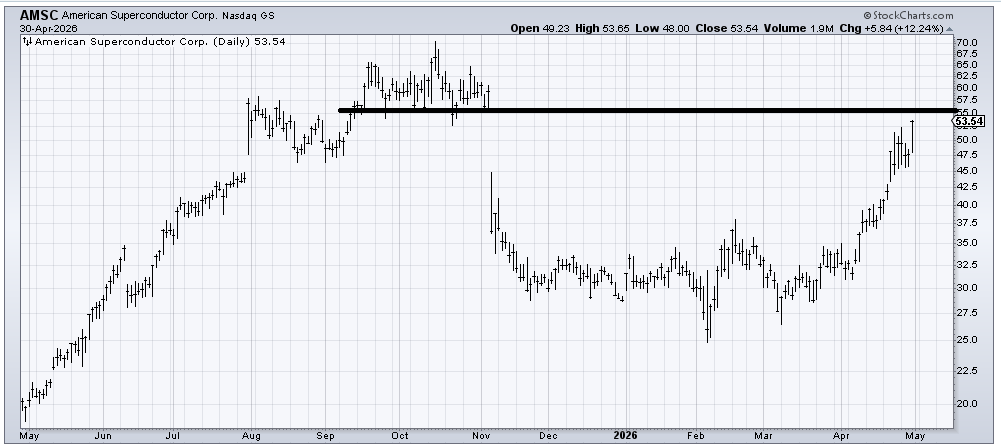
Just a reminder on American Superconductor (AMSC) , which I recommended months ago and was asked about again a week or so ago, it is on the verge of filling that gap in the 55-58 area. While it hasn’t done a thing wrong, I am a fan of taking something off the table when a stock has nearly doubled in a short period of time.
Today’s Indicator
The ISE Call/Put Ratio’s 21-DMA is discussed in full above.
Q&A/Reader’s Feedback
Helene welcomes your questions about Top Stocks and her charting strategy and techniques. Please send an email directly to Helene with your questions. However, please remember that TheStreet.com Top Stocks is not intended to provide personalized investment advice. Email Helene here.
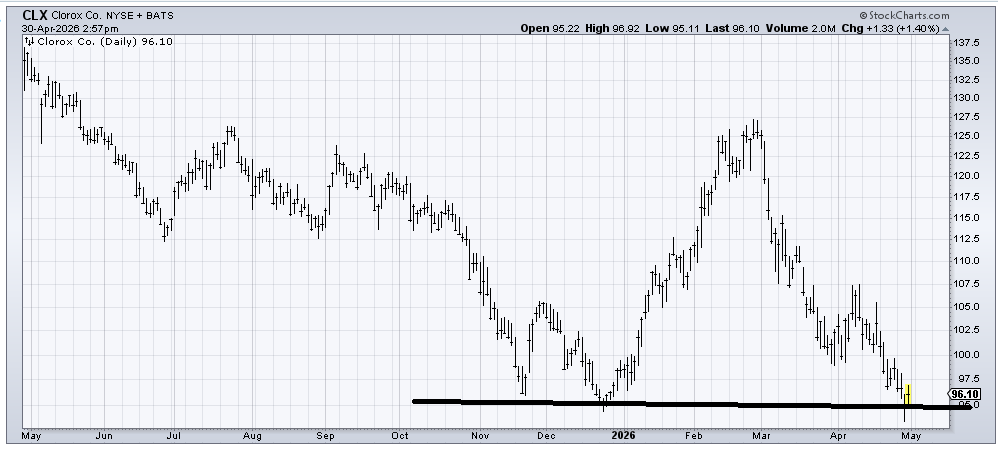
I will typically not comment on a stock when it is on the verge of reporting earnings, but several folks have asked about Clorox (CLX) since we had such a great trade off that December low, and the stock has returned to that area. I think it is worth a shot again down here. I suppose if it cracks under this support and cannot recapture the 95 area in a hurry, I’d think I was wrong.
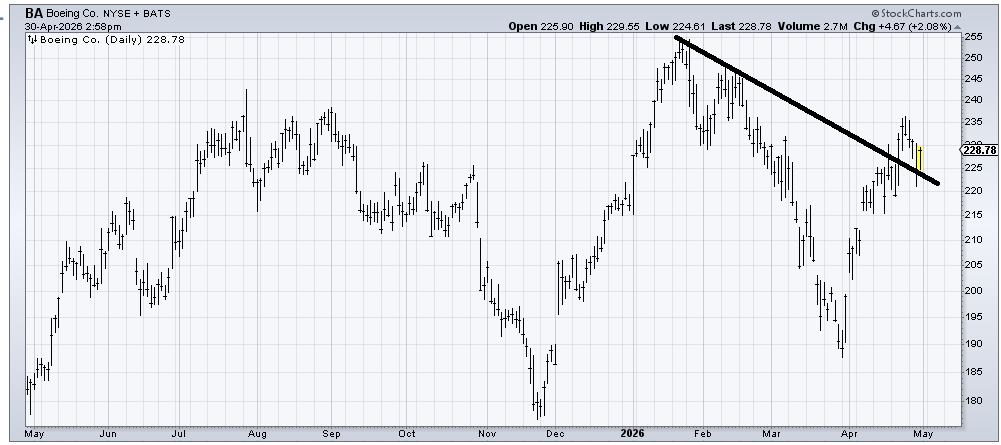
Boeing (BA) had a great bounce off that late March low. Now I feel as if it is in the middle of nowhere. I would say a bounce off this line is good. If it cannot get up and over that mid-April high within the next week or so, I would get concerned. That 235 area has been tough for the stock over time.
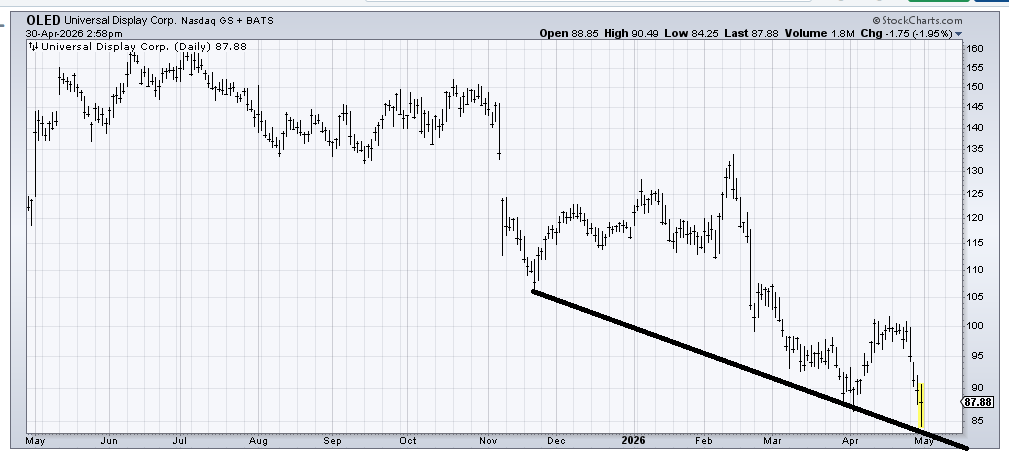
Universal Display (OLED) has been such a disappointment. The stock remains in a downtrend. The good news is that it has been bouncing off this line for a while, so if you want to trade it, then this is the spot.
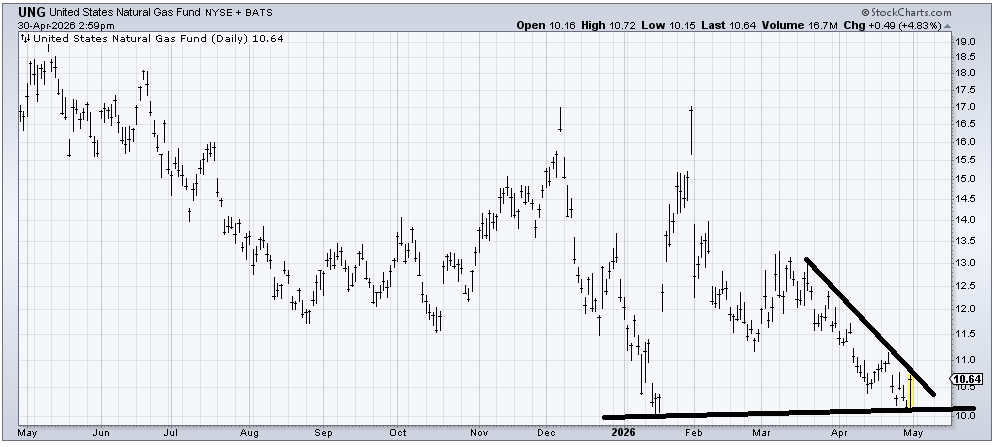
(UNG) , an ETF to be long Natural Gas, is not for the faint of heart. That having been said, if it can cross that downtrend line, then I think it can run to 11.50-12. It is always a trade, not an investment. Why? It is a widow-maker.
Related: How U.S. Investors Can Profit After Crazy Day for Japanese Yen
