Dow Jones Industrial Turns Bullish but I Recommend Caution
After the major equity indexes closed mostly lower, the data finds that two of the three sentiment data points are flashing red again.
You've reached your free article limit
You've read 0 of 1 free Pro articles.
The major equity indexes closed mostly lower Thursday with mixed NYSE internals while the Nasdaq’s were negative.
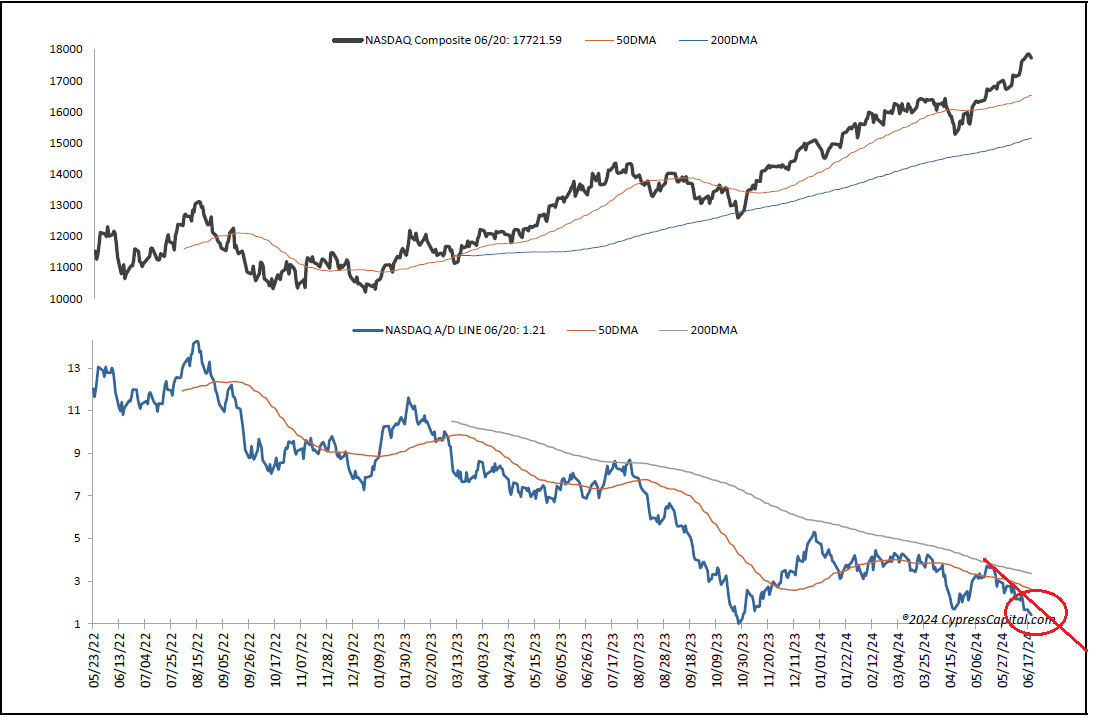
They closed at various points within their intraday ranges with two indexes closing above resistance, leaving their near-term trends a mix of bullish and bearish projections. While one day does not make a trend, there appeared to be some slight rotation from some of the recent market leaders into other names. However, we would continue to pay attention to cumulative market breadth that deteriorated further, particularly on the Nasdaq.
The data finds the OB/OS oscillators neutral, but two of the three sentiment data points (contrarian indicators) are flashing red again while forward valuation of the SPX based on Bloomberg’s forward 12-month earnings estimates remains well extended above ballpark fair value. As such, we remain of the opinion that market risk is relatively high and caution should be employed when approaching equities in general.
On the charts, the DJI and DJT closed higher Thursday as the rest posted losses.
Closing prices were mixed regarding their intraday ranges with some near their highs and others near their lows of the session.
On the positive side, both the DJI and DJT closed above resistance that turned the DJI chart from neutral to bullish as are the SPX, COMPQX and NDX.
However, we would note that the SPX, COMPQX and NDX formed “bearish engulfing patterns” that imply the potential for some further weakness.
The DJT, MID and RTY remain bearish.
Cumulative market breadth is bearish as well for the all exchange and Nasdaq with the Nadaq’s A/D making another lower low that we find disconcerting as it implies a weakening of the market’s internal structure.
No stochastic signals of import were generated.
The data remains largely neutral.
The one-day McClellan OB/OS Oscillators are neutral (all exchange: -41.71, NYSE: -33.84, Nasdaq: -46.76).
The percentage of SPX issues trading above their 50 DMAs (contrarian indicator) rose to 51, staying neutral.
Of note, the detrended Rydex Ratio (contrarian indicator) turned bearish at 1.24 from its prior neutral reading of 0.77. So, two of the three sentiment indicators are cautionary with this week’s AAII bear/bull ratio (contrarian indicator) at a neutral 0.69 but the investors intelligence bear/bull ratio (contrary indicator) staying bearish at 17.6/60.3 as bulls well outweigh bears.
The open insider buy/sell ratio remains neutral but dropped to 36.1 from 40.2.
Leveraged ETF sentiment is 19.3 remaining neutral.
Regarding valuation, the 12-month consensus earnings estimate for the SPX from Bloomberg dipped to $253.22. Its forward p/e of 21.6 remains well above the “rule of 20” ballpark fair value at 15.8. It remains an important concern for us as an almost 600-basis point premium remains significant. Its earnings yield is 4.63%.
The 10-year treasury yield rose to 4.25. Support is 4.18% and resistance at 4.35%. Its near-term trend is bearish.
The U.S. dollar, via the UUP ETF, closed higher at $29.03. Its trend remains bullish. Support is $28.78 and $29.06 as resistance.
Thus, breadth, sentiment and valuation suggest not all is well for equities in general. We remain cautious.
At the time of publication, Ortmann had no positions in any securities mentioned.