CFTC Report Shows Funds Over Their Skis in These Two Markets
These positions have grown to oversized proportions thanks to trend traders piling in and fundamental traders placing bets.
You've reached your free article limit
You've read 0 of 1 free Pro articles.
In the long run, fundamentals matter. In the short run, the reality can be skewed by aggressive market-participant positioning.
Before complaining about speculators and how they sometimes temporarily distort pricing, though, we should recognize that the pendulum swings both ways. Sometimes, speculators push assets in our favor with their optimism (currently, that can be seen in stocks, real estate and even crypto). And other times, systematic speculative selling in key commodities such as crude oil allows us to enjoy cheaper goods and services.
I would also argue that markets without speculators tend to be even more volatile and treacherous. With all of that said, we’ve noticed two seemingly-unrelated markets that appear to have overcrowded trades in the opposite direction. Thus, the unwinding of these trades might coincide with each other.
It never fails; things are the worst when they feel the best, and vice versa. Markets and industries go through cycles; it is a constant game of survival of the fittest. This fact is less obvious when trends are running hot, but we will all be reminded eventually. Those who are savvy and lucky enough to be left standing after the fat is trimmed from an expansion cycle are set up to excel. Sadly, many market participants fail to realize their holdings are aggressive until a sharp price reversal sends them a memo.
We are probably near a climax of euphoria in the equity market (and economy) and a capitulation of misery in ags.
The data suggests asset managers are complacently holding one of the most significant net-long positions in the history of the E-mini S&P 500 and the boldest bearish position in grain futures.
These positions have grown to oversized proportions due to trend traders piling into the strategy and fundamental traders placing bets on the Federal Reserve’s ability to thwart inflation and deliver a soft landing. The result has been a 75% negative correlation between equity indices and the ag (corn and soybean) futures.
In a normal functioning market, these two assets should have very little correlation. Yet, they are settling in the opposite direction in three out of four trading sessions over the last nine months as market participants amass historically aggressive holdings in each asset, but in opposite directions.
In recent sessions, we have seen the grains find a bid as equities are selling off; this can best be explained by the need for funds to liquidate their holdings (sell stock indices to offset longs and buy ag futures to offset shorts). Thus, if the equity market behaves poorly going forward, as we suspect, the grains should get a nice boost. In other words, if we get a long stock squeeze, it will turn into a short grain squeeze as the overcrowding unwinds itself.
Is the COT Report Telling Us Something?
First up is the E-mini S&P 500.
When discussing the Commitments of Traders (COT) report made available by the U.S. Commodity Futures Trading Commission (CFTC), we often refer to the simple legacy version composed of large speculators, small speculators and commercial hedgers.
However, in this case, we don’t see a helpful recognizable pattern on the legacy version of the report, but when we look at the “financial” version that distinguishes between the following types of large speculators: dealer or intermediaries, asset managers or institutions, leverages funds, or other reportables. We have noticed that the asset manager category — which includes pension funds, endowments, insurance companies and mutual funds — has amassed a net-long position of about 1 million futures contracts. In the past, this threshold has been a pretty good tell for a market that needs a break.
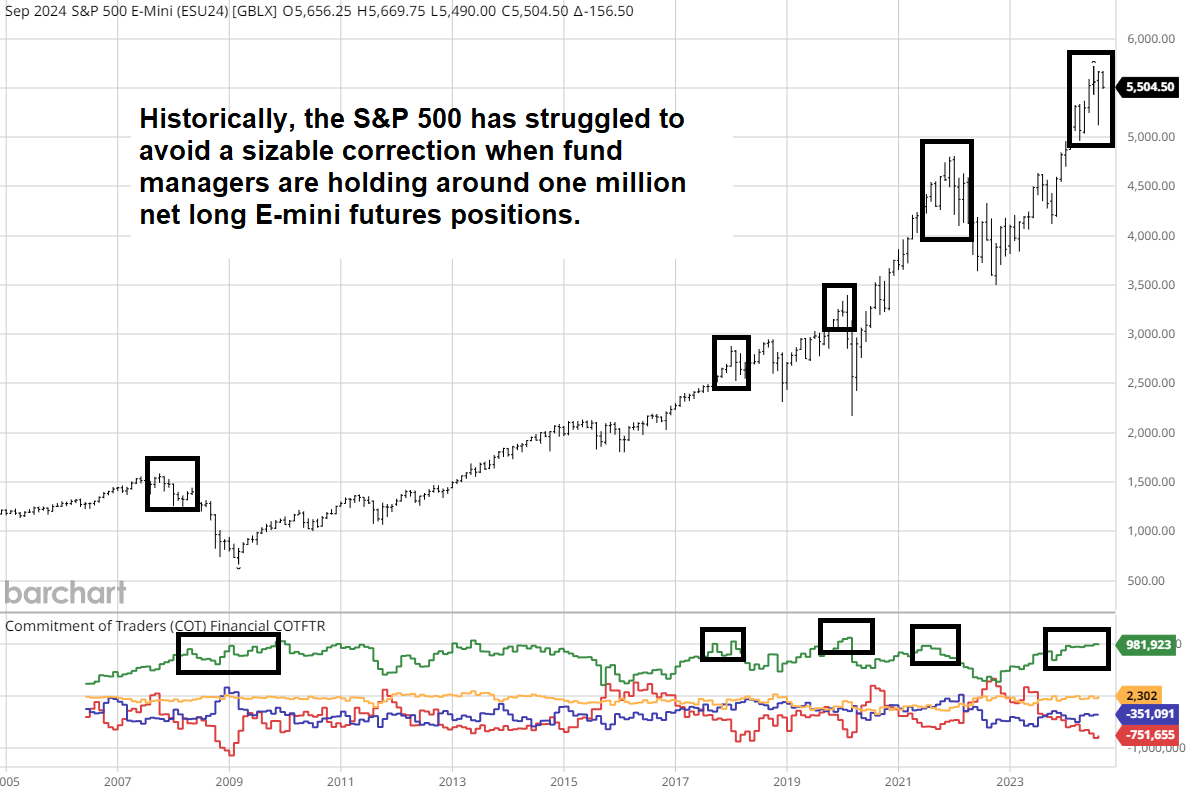
As the chart depicts, the financial crisis bear market, the 2018 pullbacks, the COVID crash and the late 2021 correction all occurred with the asset manager category of the COT report holding nearly seven-figures' worth of contracts in the futures markets. Assuming this pattern will continue, we must ask ourselves whether the August pullback was sufficient or if we are in store for something bigger. We are proceeding under the premise that a more extensive correction is looming. The charts, feelings of euphoria, overleverage and other factors are reminiscent of 2007, 2020 and 2021 (occasions in which the stock market corrections far surpassed a standard 10% correction).
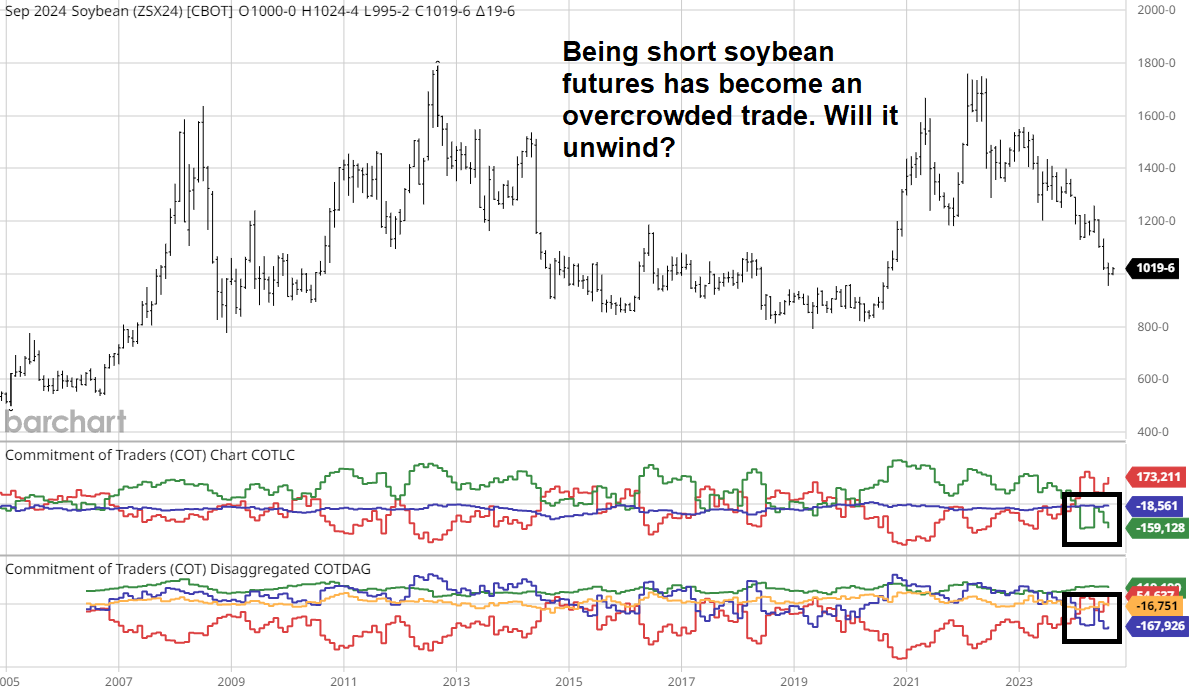
Next, let’s take a look at the grains. Both corn and soybeans have sunk to long-term trendlines as fund managers have piled on short positions. In fact, near the lows of the move, fund managers held record net short positions in the futures markets. Specifically, funds were short 170,000 net short soybean futures and about 340,000 corn futures.
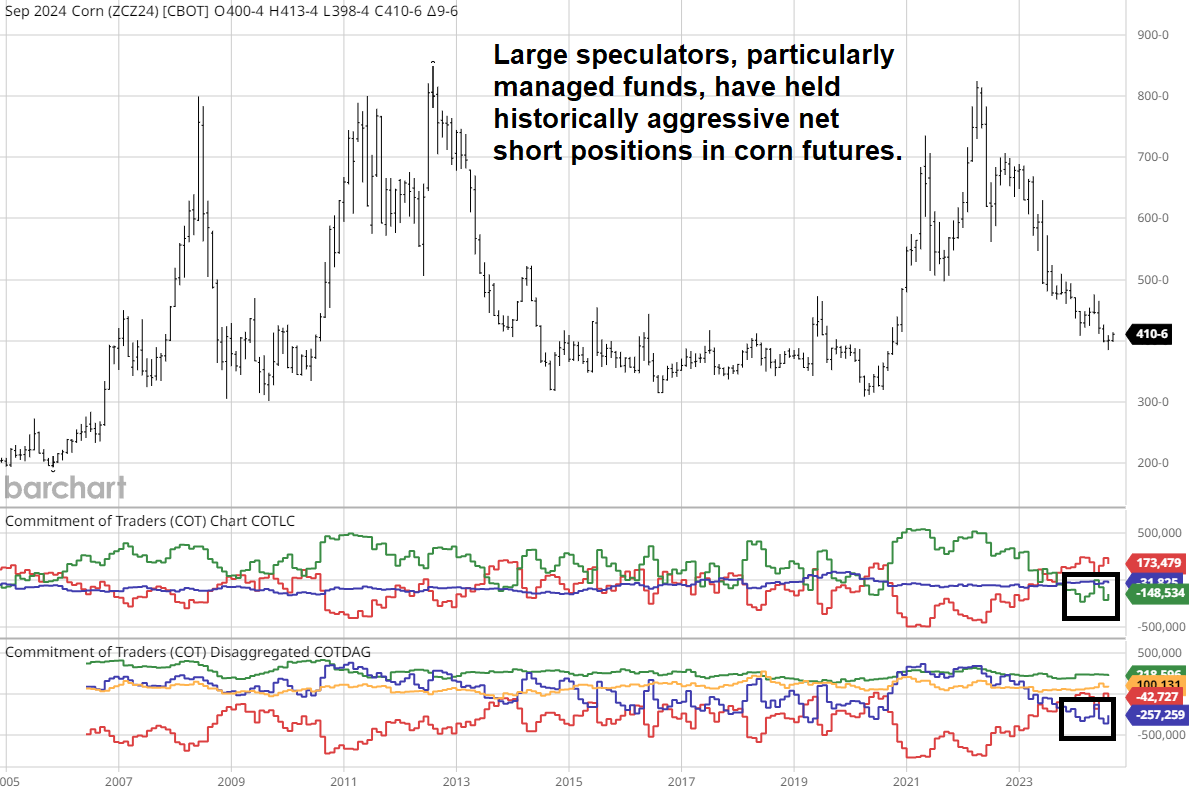
These are the largest bearish positions we’ve witnessed by large speculators and the “Managed Money” category of the long-form report. While there is no true precedence for this occurrence in grain futures, we have been following markets and the COT report enough to know this is a sign of an exhausted trend. We might very well be to a point where all the bearish news is out and all the sellers have taken action.
Monthly Chart Analysis
We shared the monthly charts of corn and soybeans in our last post, but we wanted to include them again for reference and a current look at the S&P 500.
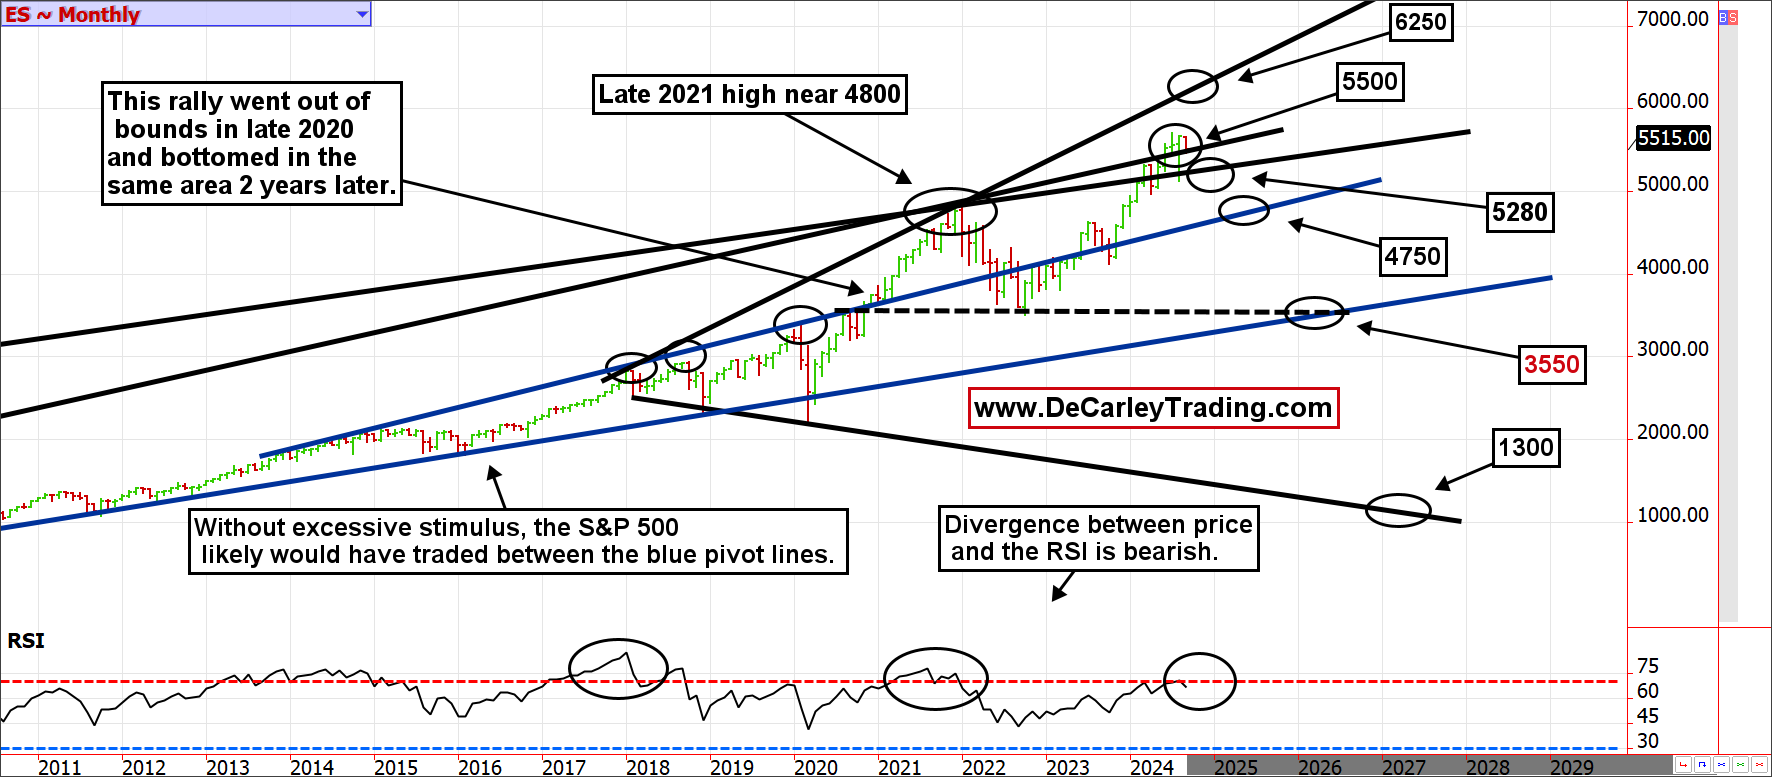
In our opinion, the S&P 500 (and other stock indices) have pulled forward gains with the help of government stimulus. This means time will need to catch up to the S&P, or the S&P will need to be repriced lower to get into a more natural state. According to historical market slopes and valuation metrics, we pin the fair price of the S&P somewhere in the mid-4000s. However, we will need to see the market break and hold below 5500 in the coming week for the mean reversion to take place. If not, and the bulls find new buyers, 6200 is in play. We do not expect this as contrarian bears, but we must respect the possibility.
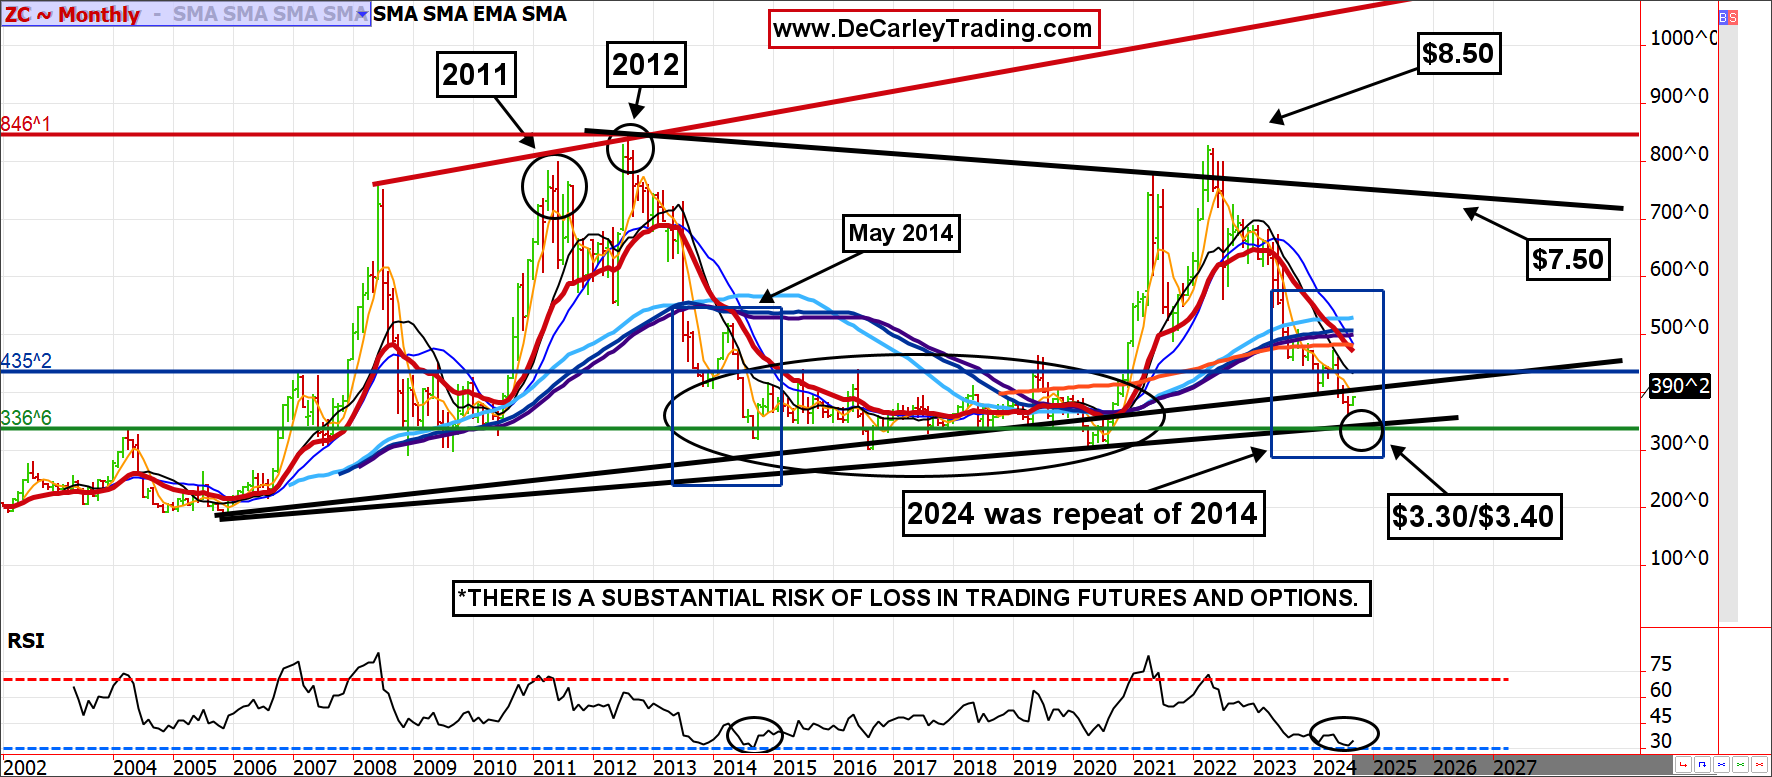
If we are right about the S&P normalizing into an equilibrium level in the 4000s, we suspect the unwinding of overcrowded trades will benefit corn and soybeans. In other words, stress and margin calls triggered by stock index weakness could easily lead to short covering in the grains. Coincidently, the chart is aligned with this thought. The 20-year trendline in corn is roughly $3.40; the low a few weeks ago was $3.60, but cash market prices in some areas were even lower. Thus, there is a good chance the market fulfilled its need to test this trend line and could be poised for stability, and maybe even a bit of a rally, as we advance. December corn will face resistance near $4.30, but a stock market sell-off might trigger a quick short squeeze to $4.60.
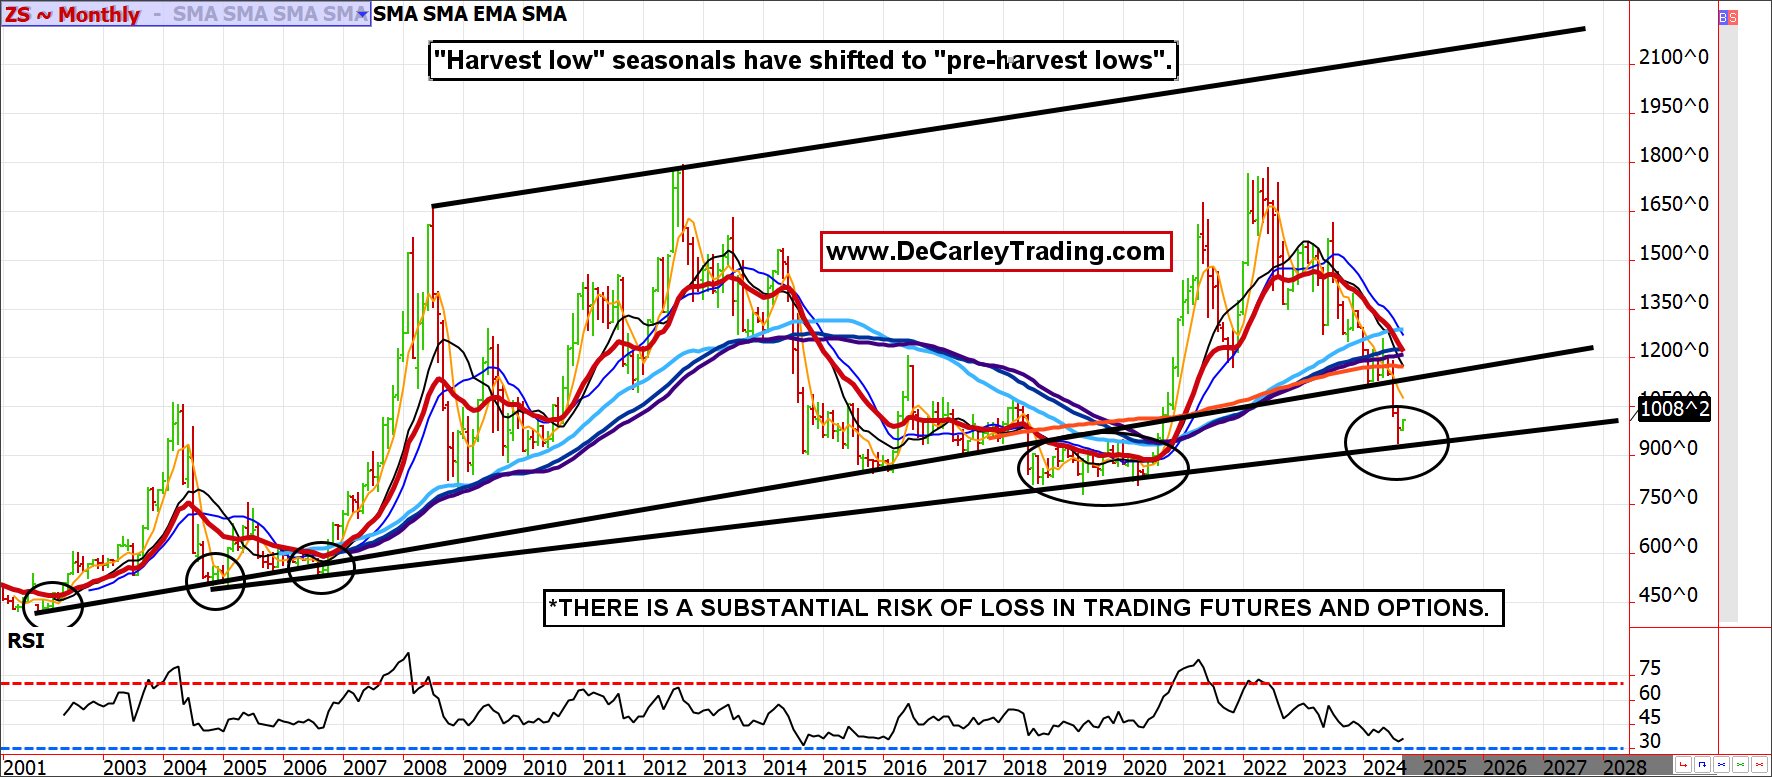
Like corn, soybean futures tested a 20-year trendline last month and found buyers to catch the falling knife. Also, like corn, if the funds go into liquidation mode (sell stock indices and buy grain futures), we could see a nice bounce regardless of fundamentals. We see resistance at $10.50, but $11.00 to $11.20 will be in play if we get a squeeze.
In Summary
Funds have accumulated overcrowded positions on the long side of the E-mini S&P 500 futures contract and the short side of corn and soybean futures. As a result, these markets are moving in the opposite direction at a high degree of negative correlation. Thus, we can assume a mean reversion correction in the stock market at the hands of fund liquidation, as we expect, would lift the grain markets from funds unwinding bearish holdings.