Bulls Are Moseying Over to the Fence — And Starting to Jump It
It is a rare event that moves the bulls this much, so let's take a close look at what's happening in the 'neighborhood.' Plus the chart we need to watch now, the S&P relative to the Nasdaq.
You've reached your free article limit
You've read 0 of 1 free Pro articles.
Note: I am taking a few days off to visit my mother. My next column will be Tuesday, April 30th.
We can begin today with another acknowledgement that I am terrible at narratives. When asked last week what it was that might force an oversold rally I thought interest rates backing off would do the trick. Sure, we got an oversold rally but interest rates sat there like something my cat dragged in.
I also thought it would be the move in the yen that might cause us to head back down after the rally but that too looks like I will be wrong. It seems Meta’s META action after hours might help that along.
So rather than discuss what the news might be that moves the market let’s discuss the indicators. The intermediate-term indicators still haven’t moved much this week. The rally the last few days slowed the pace of those that were heading to an oversold condition and obviously the rally wasn’t strong enough to change any of the indicators.
The McClellan Summation Index did stop going down but it hasn’t turned up yet. But at least it is much closer to doing so than it was a week ago.
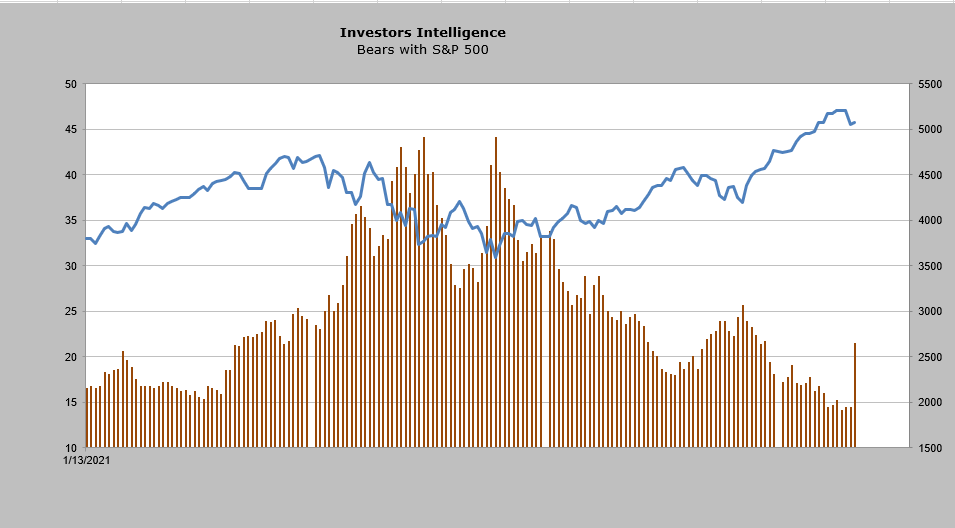
The intermediate-term sentiment indicator that did change, and changed much swifter than I thought it would is the Investors Intelligence survey. It is a rare event that moves the bulls 10 points in either direction, but last week pushed the bulls down that much to 46.2%. They got to 42% last autumn.
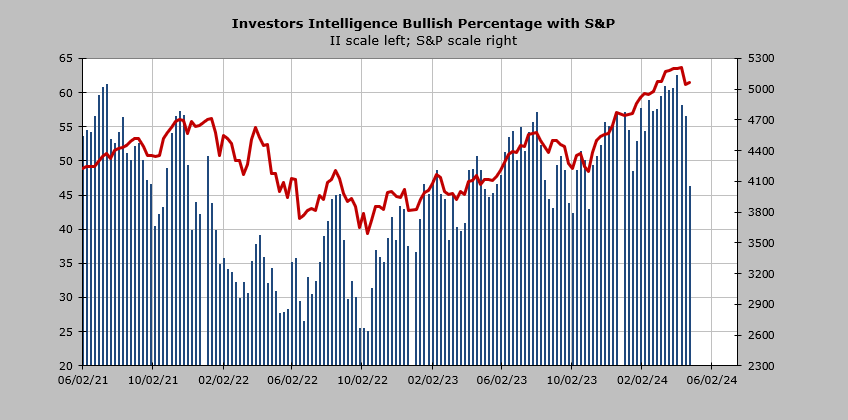
Then there are the bears, which were sitting at 14%. They jumped seven points to 21.5%. Last fall they got to 26%. You can really see the surge on the chart though.
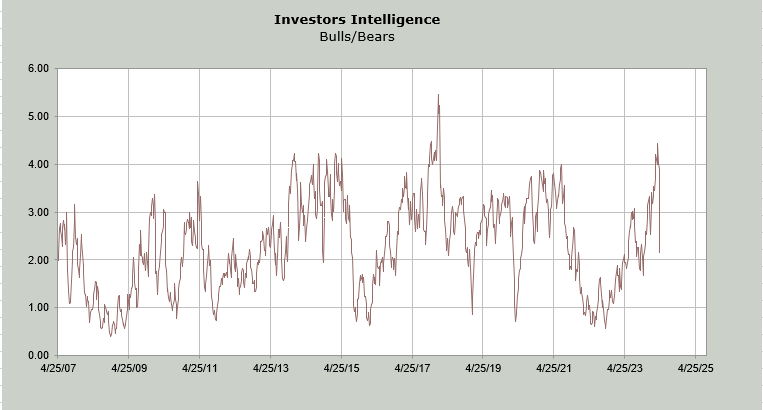
Finally there is the bull/bear ratio. A few weeks ago I highlighted their move when there were four bulls for every bear. Needless to say that is a pretty rare event. And now that ratio has plunged to just over two bulls to every bear. At the October low it was just under two to one. In October of 2022 it got under one, which is really too bearish.
But the point in taking you through this is that this is what I mean when I say it takes some time to get the bulls to mosey over to the fence and finally jump it. The S&P 500 made its high in mid-to-late March and the bulls were at 62% then. Perhaps last week’s plunge was them jumping over the fence.
You can now see how should we get another push down they may be climbing over each other just to get from the bull to the bear camp. And that ultimately is bullish.
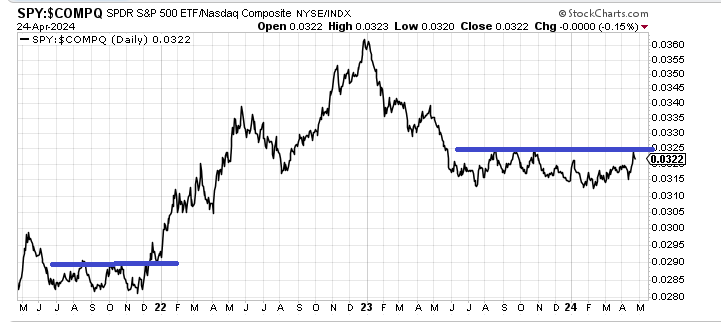
What we need to watch now is this chart of the S&P relative to the Nasdaq. When we are in a range, it is generally bullish for stocks. When this ratio breaks out it changes that equilibrium. As we headed into 2022 you can see the breakout to the upside and now a similar breakout looms. If it breaks out to the upside it means folks are shying away from growth and running to safety.