Bloody Wednesday, House of the Wicked, Trading ServiceNow, Jobs That Never Were
It was a hardcore risk-off trade Wednesday, with honest conviction behind it. And the downside leaders, among AI and software names, took an unspeakable pounding.
You've reached your free article limit
You've read 0 of 1 free Pro articles.
The wind blew in from another direction on Wednesday. A paper bag wafted above the street, if only for a moment. The moment passed. The bag fell from vision.
We heard someone shouting in the distance. Too far to really understand. Someone thought they smelled smoke. No one was sure. The wind intensified. It felt cold. We looked each other in the eyes and started to shiver. For this felt different. We saw the blood. Not a word spoken at this point between us. For this day, this brutal day, perhaps we now felt... vulnerable.
Risk Off
On Wednesday morning, U.S. equities gapped lower on the open, and proceeded to sell off into lunchtime. There was no lunchtime. A brief attempt to stabilize the marketplace was made shortly after midday. Then it was "risk-off."
It was hardcore risk-off from that point into the closing bell. There were, for the day, really two three-hour selloffs during the six and a half hour regular trading session on Wednesday. I guess someone must have taken a break for lunch and then got back to the business of turning equities into cash after being fully sated.
The S&P 500 closed 2.31% lower for the day, the worst beating suffered by that index since December 2022. The Nasdaq 100 and Nasdaq Composite ended the day down 3.65% and 3.64%, respectively. That was the worst one-day performance for those indexes since October 2022. The children heard riders in the distance. Are they ours? Uhm... no, Ma'am.
To give those who might have missed Wednesday for one reason or another, the top performer among domestic U.S. mid-major to major indexes was the Dow Transports. The Transports "outperformed" at -1.22%.
The small-caps may have been a better place to hide than were large-caps, but they still were not a better place to be than cash. The Russell 2000 and S&P 600 were taken out to the woodshed for beatings of 2.13% and 1.88%, respectively.
The further and further we dig, the worse it gets for Wednesday. Bloody Wednesday.
House of the Wicked
It has been said that fear is but for the wicked. So, let us not fear. We are not the wicked. Let us regroup, patch ourselves up, and stiffen our resolve. The wicked, my friends, will tremble before us before the moon rises again. We know this because we are the defenders of whom we love. We know this, because we are who we are, the lost boys and girls of another time and place... and we are all we need.
By day's end on Wednesday, eight of the 11 S&P sector ETFs closed in the red. That's a little misleading as two funds closed very close to "unchanged." There were two winners among the 11, both defensive in nature. The Utilities XLU were up 1.12%, followed by Health Care XLV. Seven of the 11 closed down more than 1%, while four closed down more than 2%. Two funds among the 11 closed down more than a stunning 4%. Technology XLK gave up 4.14%, while the Discretionaries surrendered 4.09%.
Peering into the Tech sector, the Philadelphia Semiconductor Index gave up 5.41% for the day, led lower by Arm Holdings ARM, Broadcom AVGO and Nvidia NVDA. Those three stocks finished down 8.17%, 7.59% and 6.8%, respectively.
AI? Artificial Intelligence names went on sale on Wednesday. The Dow Jones US Software Index lost 3.55% for the day. The downside leaders here took an unspeakable pounding. The Trade Desk TTD was shredded for 11.49%, followed by Unity Software U, and my beloved Palantir Technologies PLTR. Those two were hit for 7.8% and 7.67%, in that order.
Dragon's Breadth
Losers beat winners on Wednesday at the NYSE by roughly 9 to 2 margin and at the Nasdaq by something close to 13 to 4. It gets uglier, gang. Advancing volume took a 22.4% share of composite trade for those names listed at 11 Wall Street, but a more respectable 41.5% share for those names listed up at Times Square.
This is the kicker. Aggregate trade on a day-over-day basis, was up 12.7% for NYSE-listed names and up an incredible 36.4% for Nasdaq-listed names. What that means is that the selloff was heavily participated in by professional managers. There was honest conviction behind the risk-off trade on Wednesday.
Since June's triple-witch expiration, the aggregate trading volume of the S&P 500 has exceeded its own 50-day trading volume simple moving average seven times. Six of those were red candle days. For the Nasdaq Composite, those red candle, high volume days are seven for seven.
Starting to Look Alike
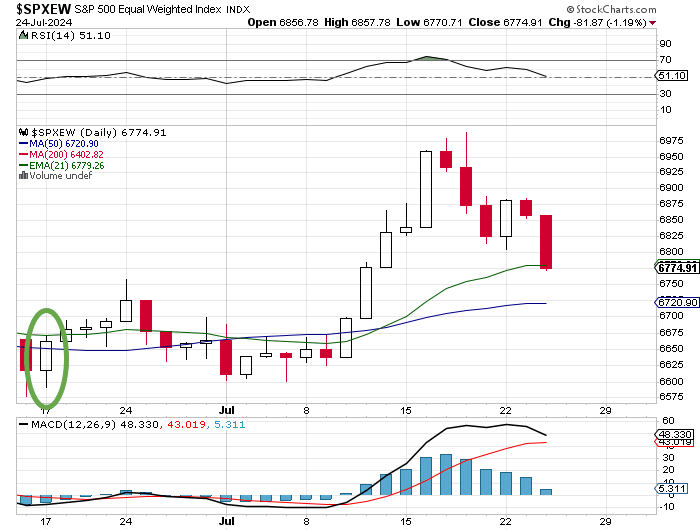
No, the indicators, such as the daily MACDs and the moving averages are not postured similarly, but of late the daily charts for the market-cap weighted S&P 500 and the equal-weighted S&P 500 are starting to correlate.
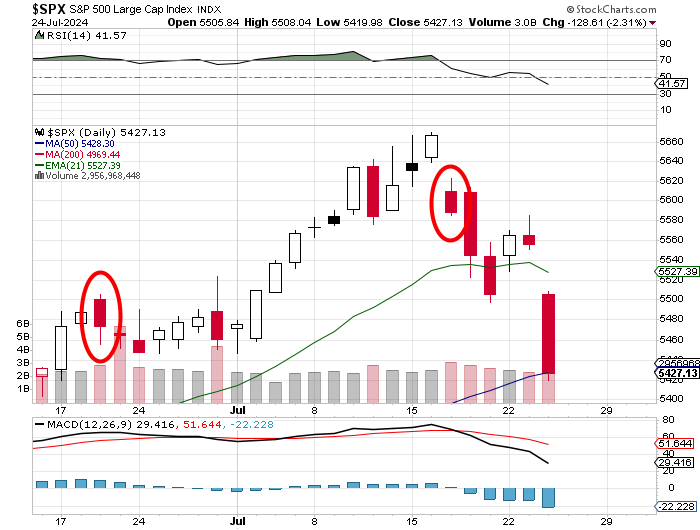
That said, the S&P 500 did find support at its 50-day simple moving average. That could help on Thursday morning. The equal-weighted version of the index got that help at its 21-day exponential moving average.
Jobs That Were Never There
Incompetence? Deceit? Who knows. Am I the only one who still cares? Sure does feel like it.
The Bureau of Labor Statistics released their Q4 2023 BED (Business Employment Dynamics) Report very quietly on Wednesday. As we did three months ago, we compare the jobs created for that period to what had been reported in near real time as Non-Farm Payrolls job creation in the monthly BLS Establishment Survey that the financial media regularly takes as gospel.
Once again, the numbers simply stun those with measurable IQs who end up reading this. Why is the BED Report understood by economists to be far more accurate than the monthly surveys? Simple. It comes out with a seven-month lag and is based on data provided by 9.1 million establishments. The monthly survey involves just 670,000 establishments and the rest is then extrapolated through often incorrect seasonal and birth/death model adjustments.
Well, the results are in. For the fourth quarter of 2023, the BED report shows 344,000 jobs created in the U.S. The Non-Farm Payrolls prints for those months, even after revisions, came to 656,000. That's an implied net overstatement of 312,000 jobs created over three months. Shall we move on?
For Q3 2023, the BED Report shows job losses of 192,000 versus the revised NFP prints totaling a gain of 681,000 jobs. That's an implied overstatement of 873,000 jobs created. For the first quarter of 2023, the two reports were very close, just 19,000 apart. Guess no one was worried about having to make labor markets appear strong just yet at that time.
The sharp disagreement in the numbers really began in the second quarter of 2023, when the revised Non-Farm Payrolls prints totaled job creation of 785,000 while the BED report shows just 332,000 jobs created. All in all, for the full year of 2023, the monthly Non-Farm Payrolls numbers in aggregate (after revisions) totaled job creation of 3.117 million positions. The far more accurate BED Report shows that number as 1.46 million jobs. The implied overstatement in job creation for the full year 2023 is 1.657 million positions.
Why even report monthly survey results if the models used are that far off. Who is to blame for either their incompetence (best case) or worse when job creation comes to just 46.8% of what was reported in close to real-time and devoured by a financial media all too eager to support a narrative?
You do know this means that GDP for 2023 likely has to be restated, and revised significantly lower, right? For 2023, full-year GDP printed at growth of 2.5%. Full-year GDI (a just as worthy measurement of economic growth as the Fed recommends averaging the two when they are not close) came to growth of just 0.4%.
You and I probably know that growth was more than arguably closer to the GDI print that the financial media pretends they never heard of, than it was to the stated GDP print. The U.S. economy was very close to recession in 2023. Very, very close.
Those economists who predicted a tough economy in 2023 and were openly mocked for it? Yeah... turns out they pretty much nailed it. The "strong economy" crowd? They were either wrong or complicit.
Can ServiceNow Save the World?
Or at least the AI trade? If anyone can, ServiceNow NOW CEO Bill McDermott can. McDermott is certainly a top-10 CEO in my book.
After the closing bell, ServiceNow posted top and bottom-line beats for their second quarter. The stock is trading 6% higher overnight after trading down 4.53% on Wednesday. Revenue growth came to 22% year over year and has run in a 20% to 26% range for years on end.
Subscription revenue grew 23%, as "remaining performance obligation grew 31%. Current (within a year) remaining performance obligation increased 22%. The firm can also boast 88 transactions over $41 million net new ACV (annual contract value) for the quarter, up 26%. For the quarter, ServiceNow generated operating cash flow of $620 million and free cash flow of $359 million.
The balance sheet is spectacular. The firm's cash position stands at $5.413 billion, with current assets at $8.021 billion. Current liabilities add up to $7.172 billion, including $5.615 billion in deferred revenue and no short-term debt. Remember, deferred revenues are not financial obligations. This puts the headline current ratio at a 1.12, which is solid, but adjusted for those deferred revenue, the current ratio rises to a very muscular 5.15.
So far, I have seen four highly rated (4+ stars at TipRanks) sell-side analysts opine on NOW. After allowing for changes, all four have "buy" ratings on the stock. One analyst did not place a price target on the shares. The average target across the other three is $908.33.
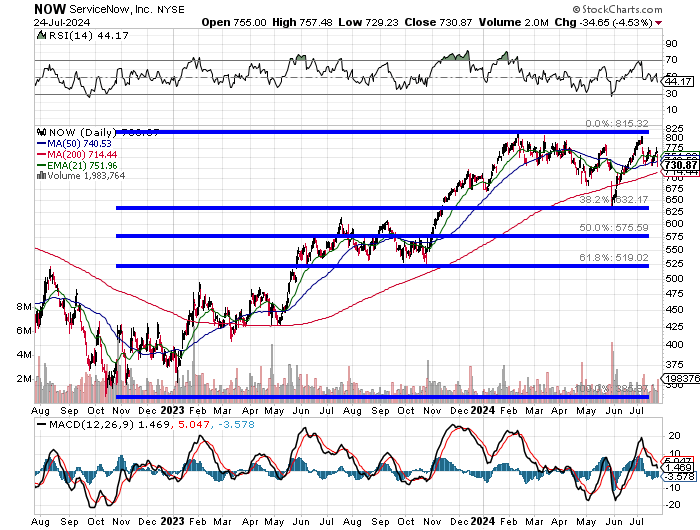
Readers can see that NOW found support up at a precise 38.2% Fibonacci retracement of the stock's October 2022 through February 2023 rally. The stock has consolidated since then, finding resistance repeatedly at the same level.
Let's zoom in:
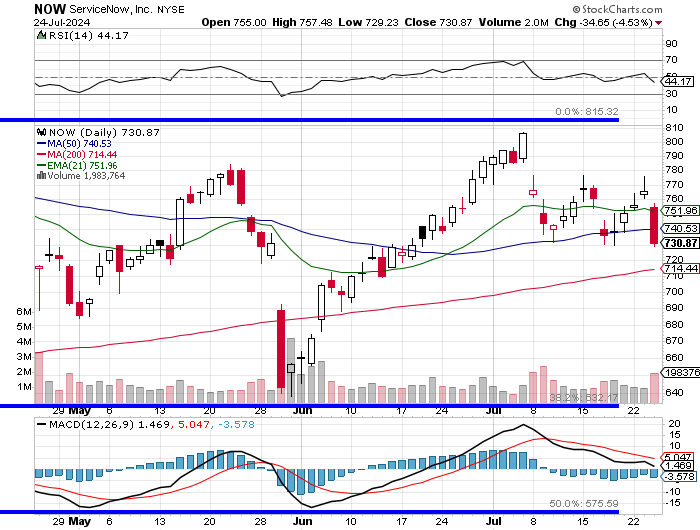
Readers will also see that NOW surrendered both its 21-day exponential moving average (losing the swing traders) and its 50-day simple moving average (losing some portfolio managers) on Wednesday. I would expect that the shares will retake both of those lines on the opening bell today.
We still have a neutral reading for relative strength and a bearishly postured daily Moving Average Convergence Divergence (MACD) to contend with. The stock needs to hold those lines on Thursday and make a high of the day higher than Tuesday's in order to put itself back in a healthy position.
The stock has been stopped at $776 three times since early June. That spot for now, is the pivot. Take the pivot, then worry about making new highs. This is not the environment to get overly extended.
My current price target is $892. I'll panic when the stock fails at its 200-day SMA.
Economics (All Times Eastern)
08:30 - Initial Jobless Claims (Weekly): Expecting 239K, Last 243K.
08:30 - Continuing Claims (Weekly): Last 1.867M.
08:30 - Durable Goods Orders (June): Expecting 0.3% m/m, Last 0.1% m/m.
08:30 - ex-Transportation (June): Expecting 0.2% m/m, Last -0.1% m/m.
08:30 - ex-Defense (June): Expecting 0.1% m/m, Last -0.2% m/m.
08:30 - Core Capital Goods (June): Expecting -0.1% m/m, Last -0.6% m/m.
10:30 - Natural Gas Inventories (Weekly): Last +10B cf.
11:00 - Kansas City Fed Manufacturing Index (Weekly): Expecting -8, Last -11.
The Fed (All Times Eastern)
Fed Blackout Period.
Today's Earnings Highlights (Consensus EPS Expectations)
Before the Open: VLO (2.76), HAS (0.78), UNP (2.71), R (2.87), ABBV (2.78), HON (2.42), RTX (1.30), NOC (5.93)
After the Close: LHX (3.18), SKX (0.94)
At the time of publication, Guilfoyle was long NOC, XLU, NVDA, PLTR and NOW.
