Assad Is Out, Trump Gives Powell a Nod, and, Wow, What a Week!
Let's look at the biggest news of the weekend, Trump's promises for his next term, and the market's positive and negative charts.
You've reached your free article limit
You've read 0 of 1 free Pro articles.
The highest profile news of the weekend had nothing to do with business or economics. I think by far, the headline news that really shook a few trees this weekend was the fall of the regime of now-former Syrian President Bashar al-Assad. There were questions over whether or not as Assad fled the nation, his aircraft had disappeared or acted strange on radar. By Sunday we learned that Assad and his family had been granted asylum by Russia and were in Moscow, according to Bloomberg, which quoted state news agency TASS.
Perhaps the most shocking thing about the fall of the government in Damascus was how quickly it happened. As the HTS rebels, who are designated a terrorist organization by the U.S. and other western allies, rapidly closed in on their objective, the Biden administration showed no interest in becoming involved and made clear that the U.S. had nothing to do with the rebellion. For his part, Pres. Elect Donald Trump in an odd sort of solidarity with the outgoing president, after the Assad regime had made overtures in the incoming president's direction, posted to social media "This is not our fight. Let it play out. Do not get involved."
Both Russia and Iran had worked to rescue the Assad regime in the past (2015), when the rebels had made advances in the long Syrian civil war. In fact, Russia still has a naval base in the country. This time, however, both of those Assad allies have had their resources stretched and their hands full, Russia in a full-scale, nearly three-year-old kinetic invasion of Ukraine and Iran in their on-again, off-again sometimes direct and sometimes by proxy war on Israel.
All the above having been said, news broke late on Sunday night that the United States had launched dozens of precision airstrikes on ISIS targets inside of Syria using B-52 Stratofortress strategic bombers, F-15E Strike Eagle fighter aircraft and A-10 Thunderbolt attack aircraft. The B-52 is a Boeing BA aircraft powered by Pratt & Whitney RTX turbojet engines. The F-15E fighter is also a Boeing (McDonnell Douglas) aircraft and also powered by engines manufactured by the Pratt & Whitney unit of RTX. RTX also manufactures most of the air to ground armaments carried about the F-15. The A-10 Thunderbolt was manufactured by Fairchild Dornier Aviation, which was acquired by M7 Aerospace in 2003. The A-10 commonly carries air-to-ground missiles manufactured by RTX and is powered by engines manufactured by General Electric GE.
I Guess Everything's Peachy
During an interview that aired on NBC's "Meet the Press" on Sunday morning, Pres. Elect Donald Trump ran through a number of potentially controversial topics. Answering questions from moderator Kristen Welker, the incoming and former president said:
On Replacing Jerome Powell as Fed Chair:
“No, I don’t think so. I don’t see it."
On Tariffs:
“I think ‘tariffs’ are the most beautiful word. I think they’re beautiful. It’s going to make us rich. We’re subsidizing Canada to the tune (of) over $100 billion a year. We’re subsidizing Mexico for almost $300 billion. We shouldn’t be.”
On Social Security:
“We’re not touching Social Security, other than we make it more efficient. But the people are going to get what they’re getting.”
What a Week!
What a week it was. Can you believe it was only a week ago that Pat Gelsinger "retired" as CEO of Intel INTC? That feels like a few weeks ago to me. This week also saw South Korean President Yoon Suk Yeol declare martial law, and nearly get impeached for doing so, and quite unfortunately, the assassination of United Healthcare UNH CEO Brian Thompson.
As far as the macro is concerned, last week we saw the ISM Manufacturing PMI continue to show month-over-month contraction, but at a decelerating pace. However, we also saw the ISM Services Purchasing Managers' Index continue to show expansion, but also at a decelerating pace. The rest of the week was largely devoted to labor market related data.
The ADP Employment Report on private sector job creation for November contracted significantly from the pace of hiring in October and fell short of what economists were looking for. This all happened while one after another, Fed heads getting ahead of this week's media blackout period, for the most part, stated their preference for the continued easing of monetary policy, at least while inflation is only accelerating, bit not raging and while labor markets and starting to show some erosion, but are still "balanced."
Then came Friday and the either "better than expected" (if one is a simpleton and only listens to the financial media) or nearly disastrous (if one actually does the homework) November jobs report. On Friday morning, in case you were out or hiding under a rock, the Bureau of Labor Statistics released the results of its twin labor market surveys for the month of November.
From the Establishment Survey, non-farm payroll job creation printed at growth of 227,000, while revising the months of September and October up a combined 56,000 for a net job creation of 283,000 positions. But the Household Survey showed a decrease of 355,000 employed persons on top of an October decrease of 368,000 employed persons. Over the past two months, according to this survey, job creation stands at negative 723,000. What else did you expect from the Bureau of Labor Statistics? Either job creation is still pretty decent or ice cold. Flip a coin.
The internals were quite ugly and over the past year or so, the Household Survey has been infinitely more accurate than has been the Establishment Survey and the BLS' own data revisions back that up. The fact is that this is a pretty nasty looking jobs report. I think it must be seen as problematic that the most significant gains in this report were made by teenagers and high school dropouts. That tells us that the quality of the jobs that are being created are probably on the lower end of the income scale. The unemployment rate is rising for high school grads, and those with some college or with associate degrees. That also tells us something about large swaths of middle-class jobs that are likely being lost. One may have also noticed the sharp increase in unemployment among those of Black or African American ethnicity. That's not good, either.
Marketplace
Yes, both the S&P 500 and Nasdaq Composite have now posted three week winning streaks. Yes, the S&P 500 and the Nasdaq Composite went out last week at an all-time record high close and closed at record highs repeatedly last week. The wealth was not well spread. Breadth was on the weak side all week long as the U.S. Dollar Index moved sideways and WTI Crude moved lower.
More importantly, Treasury yields moved lower across the entire slope of the Treasury curve, but even that was not what stole "the financial show." It was Bitcoin that took center stage last week, flirting with the $100,000 level on a per token basis before finally bursting past that level. Even so, Bitcoin has had trouble holding that level over the weekend.
Back to equities, capital rolled out of small to midcap stocks and several industry specific groups and into growthy type names. This put a bid under the Nasdaq indices more so than their peers.
As for the major to mid-major US equity indices last week....
- The S&P 500 gained 0.25% on Friday to close the week up 0.96%.
- The Nasdaq Composite gained 0.81% on Friday to close the week up 3.34%.
- The Nasdaq 100 gained 0.92% on Friday to close the week up 3.31%.
- The Russell 2000 gained 0.54% on Friday but closed the week down 1.06%.
- The S&P Small Cap 600 gained 0.1% on Friday but closed the week down 1.43%.
- The S&P Mid Cap 400 gained 0.08% on Friday, to also close the week down 1.03%.
- The Dow Transports gave up 0.57% on Friday to close the week down 4.2%.
- The Philly Semiconductors gained 0.69% on Friday to close the week up 2.73%.
- The KBW Bank Index gained 0.05% on Friday but still closed the week down 1.84%.
On Friday, only three of the eleven S&P sector SPDR exchange-traded funds closed in the green, with the Discretionaries XLY out in front at +2.11%. Energy led the losers at -1.7% for the day.
For the week, still only three of the eleven S&P sector SPDR ETFs closed in the green, led by the Discretionaries at +4.72% and followed by Technology XLK and Communication Services. Those two funds were up 3.04% and 2.57% for the week. Energy suffered a loss of 4.72% (not a misprint), leading six of these funds that gave up at least 2% for the five-day period.
Earnings
According to FactSet, which is upon whom I rely for all things earnings-related, with third-quarter earnings largely completed, the S&P 500 in aggregate produced earnings growth of 5.9% on revenue growth of 5.6%. Those numbers were up 4.2% and 4.7% respectively, from where they were at the start of the quarter.
For the current (fourth) quarter, FactSet sees earnings growth at 11.9% on revenue growth of 4.8%. The big banks are set to start reporting Q4 earnings in mid-January. For the fourth quarter, a lot is expected of the Financials who are seen growing earnings 39.1%, while Energy is seen suffering an earnings contraction of 23.2%.
For the full year, S&P 500 earnings growth of 9.6% on revenue growth of 5.1%. Looking ahead, projections for the full calendar year 2025, earnings growth is seen at 15% on revenue growth of 5.8%.
The S&P 500 ended last week trading at 22.3-times forward looking earnings, which is well above the five (19.7) and 10-year (18.1) averages for the index. The index is also trading at 28.7 times trailing twelve-month earnings, which is also well above the five (24.1) and ten-year (21.9) averages for the index.
The GDP Game
Last week, the Atlanta Fed revised their GDPNow model for the fourth quarter up to growth of 3.3%, up from 2.7% (at a quarter-over-quarter, seasonally adjusted annual rate). Among other central banks running close to real-time GDP models for the current quarter, the New York Fed increased its estimate for Q4 growth to 1.89% from 1.81%, while the Cleveland Fed still sees Q4 growth of 1.84%. The St. Louis Fed has now revised their model for Q4 GDP growth down to 1.24% from growth of 1.31%.
You read that right. The Atlanta Fed is now up at growth of 3.3% for the fourth quarter, while the St. Louis Fed is down around 1.24%. How can that be? You know what's awesome? Both of those models have been rather accurate in 2024, and now at least one of them is way, way off course.
Positive Charts
On the above chart of the S&P 500 and the below chart of the Nasdaq Composite, readers will see the confirmation of the upward trend that we pointed out here in mid-November after both of our major equity indices had tested support at their respective 21-day exponential moving averages.
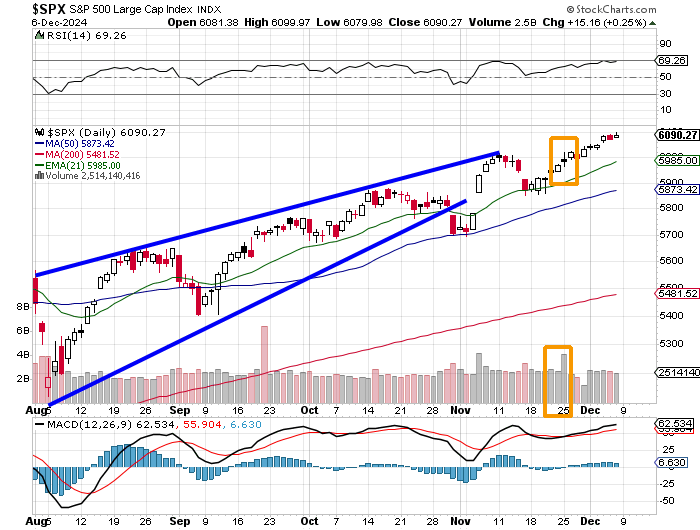
Both the S&P 500 and the Nasdaq Composite are testing the waters of readings for Relative Strength (above the charts) that are just starting to look technically overbought.
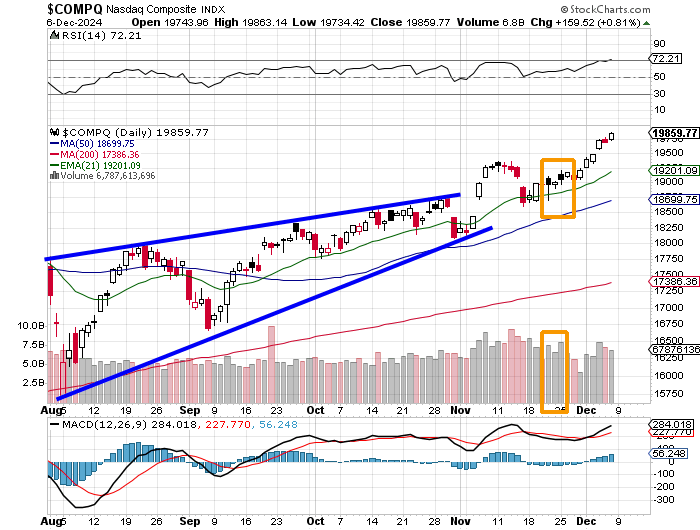
Both of these indexes can also show off bullish looking daily Moving Average Convergence Divergence indicators (below the charts), where all three components (9-day, 12-day, and 26-day exponential moving averages) stand well above the zero -bound and the 12-day line has accelerated above the 26-day line as December seasonality has kicked in.
Negative Charts
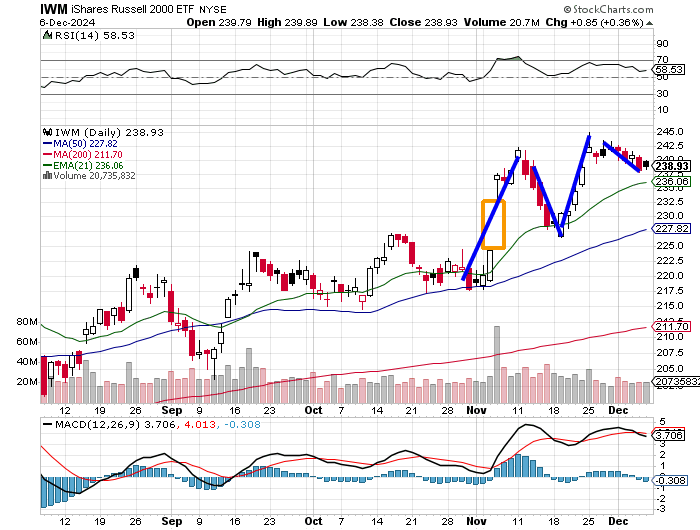
Readers will also see that the capital that has propelled the S&P 500 and Nasdaq Composite had to come from somewhere. Below, charts covering the same time period as those above will show the iShares Russell 2000 exchange-traded funds and the Dow Jones Transportation Average have developed what has started to look like double top reversals even as there has been a clear rotation out of certain corners of the market into others. Seasonality has not been an aid to smaller cap stocks nor for certain narrowly defined mid-major indexes.
Readers will see that the Russell 2000 IWM ETF displays a neutral looking RSI (relative strength) as well as a daily MACD that has just suffered a bearish cross-under of the 26-day exponential moving average by the 12-day exponential moving average, while the histogram of the 9-day EMA has crossed below zero.
It's been even tougher for the Dow Transports. Remember, the smaller caps and the transports often run with GDP, so clearly there is now some disconnect between what the BEA and Atlanta Fed are telling us and what investors are seeing.
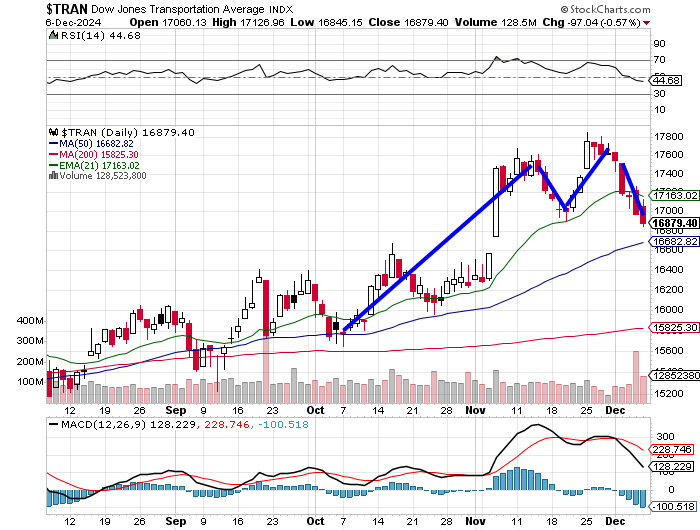
The Dow Transports are clearly further along in the deterioration of that market than are the small caps.
The Week Ahead
As was the case last week, the story of the week will be told from a macroeconomic perspective. Last week was about November jobs. This week will be about November inflation. The headline-level data will be published this Wednesday, also by the Bureau of Labor Statistics, when they publish the November consumer price index report on consumer prices. The BLS will also publish their report on November Producer Prices this Thursday and their report on November Import and Export prices this Friday.
Outside of the macro, the U.S. Treasury Department will go to auction this Wednesday and Thursday with $39 billion worth of new Ten-Year paper and $22 billion worth of new Thirty-Year Bonds respectively. The Fed has gone into their media blackout period ahead of the Fed's Dec. 18 policy decision, so we'll hear no chirping from that crowd this week.
Lastly, while we are in between earnings seasons, there always seems to be a few headline names that report out of this season and this week indeed, will contain a few higher-profile corporate releases. This evening, we'll hear from Oracle ORCL and MongoDB MDB, while GameStop GME will report on Tuesday evening. On Wednesday afternoon, Adobe Systems ADBE will step to the plate followed on Thursday evening by Broadcom AVGO, Costco COST and RH RH, which is the former Restoration Hardware.
What Else? The Mets!
The New York Mets have apparently come to an agreement with star outfielder Juan Soto (who played with the New York Yankees last year) on a 15-year, $765 million contract, with a player opt-out after five years, that with incentives could rise above $800 million. The deal includes or involves a $75 million signing bonus. The New York Yankees and Boston Red Sox had also made serious bids for Soto's services.
Economics (All Times Eastern)
10:00 Wholesale Inventories (Oct-rev): Flashed 0.2% m/m.
The Fed (All Times Eastern)
Fed Blackout Period.
Today's Earnings Highlights (Consensus EPS Expectations)
After the Close: AI (-.16), CASY (4.29), MDB (.69), ORCL (1.48)
At the time of publication, Guilfoyle was long RTX, GE, INTC equity.
