Are Stocks Preparing for a Deeper Pullback?
Let's chart the major indexes, and take a closer look at a trouble spot where there's more to the story.
You've reached your free article limit
You've read 0 of 1 free Pro articles.
Happy New Year to all our readers! I hope 2025 is a healthy and prosperous year for every one of you.
In the markets, Santa’s reindeer have made a detour, as the Santa Claus rally has failed to materialize. This is supposed to be the most wonderful time of the year for stocks, but instead, investors are finding coal in their stockings.
Is recent market volatility a short-term blip, or is a deeper pullback in our future? Let’s go to the charts and check in on the major indexes:
Dow Jones Industrial Average and Russell 2000 Index
On December 4, the Dow Jones Industrial Average (left chart) reached an all-time closing high. That record high was followed by 10 consecutive losing sessions. A recent attempt at a rally failed, and now the index has closed below its 50-day moving average (blue) for eight consecutive sessions.
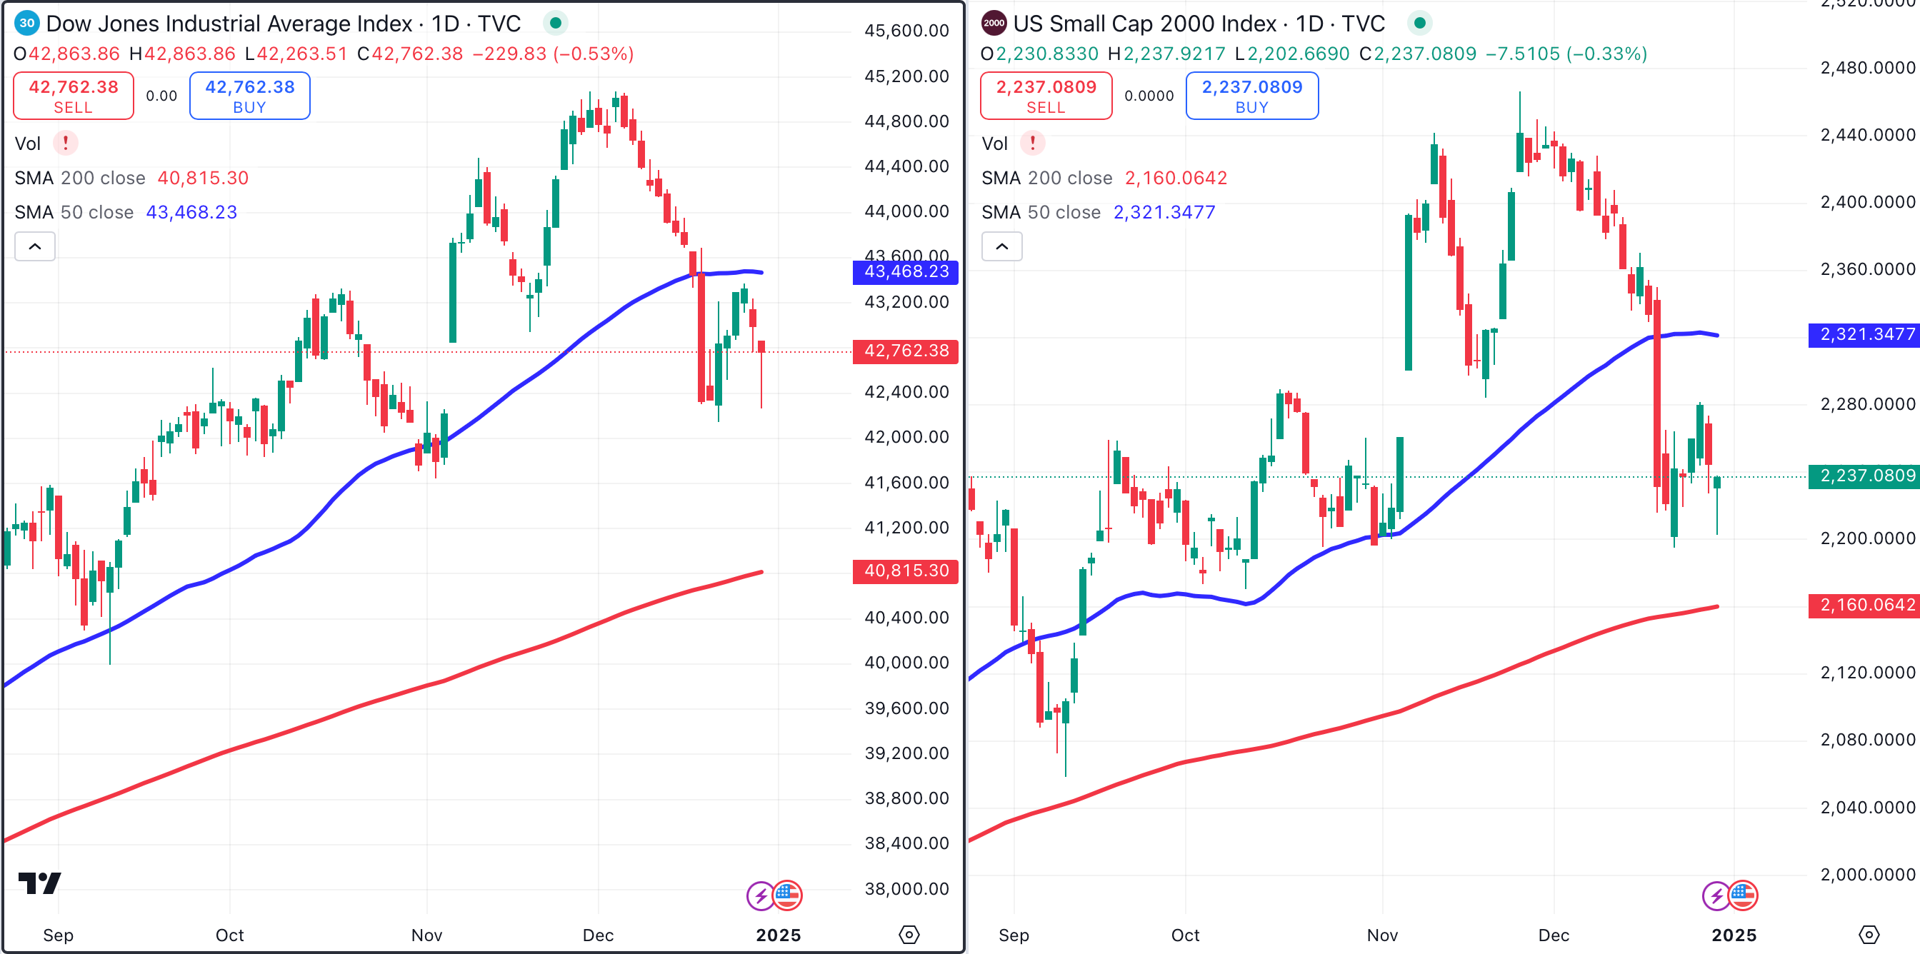
Meanwhile, the Russell 2000 (right chart) has also closed beneath its 50-day MA (blue) for eight consecutive sessions. Both indexes have surrendered their post-election gains, and are flirting with two-month lows.
S&P 500 and Nasdaq 100
On Monday, the S&P 500 (left chart) fought valiantly but failed to close above its 50-day MA. Monday’s price action proved that dip buyers are still active, but despite this, a bearish reversal pattern may be forming (shaded yellow).
The good news is that the downside is fairly limited. Based on the size of this pattern, it’s possible we could see a deeper pullback to the 5700 area.
Keep in mind that a pullback to 5700 would put the S&P 500 at October levels. In other words, it’s not time to panic. In fact, it might create an opportunity.
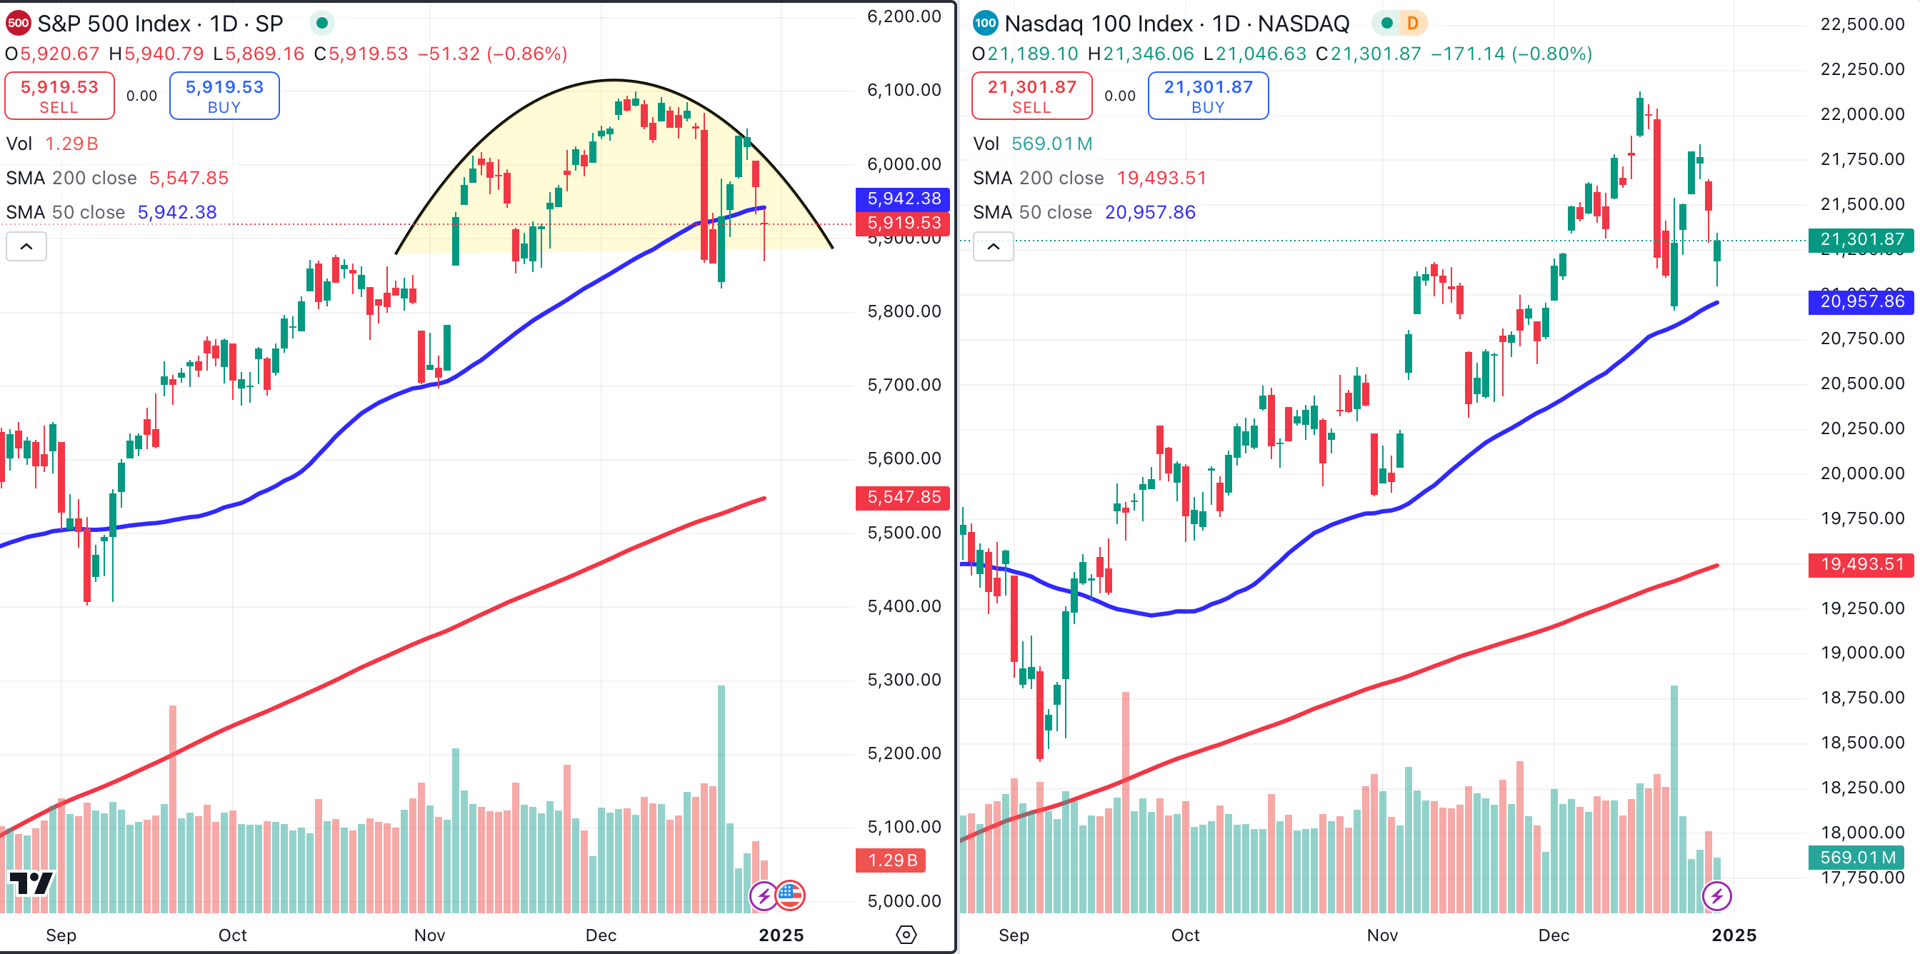
The Nasdaq 100 (right chart) remains the class of the field, as it’s the only major index currently above its 50-day MA (blue).
Sherwin-Williams and Caterpillar
Because the Dow Jones Industrials are trading heavy, I thought I’d check to see where the damage is concentrated. Two names stood out, due to their profound weakness.
Sherwin-Williams SHW (left chart) reached an all-time high just over a month ago, on November 25 (green arrow). Since then the stock has splattered to a 14.6% loss. Sherwin-Williams has fallen below both its 50-day (blue) and 200-day (red) moving averages.
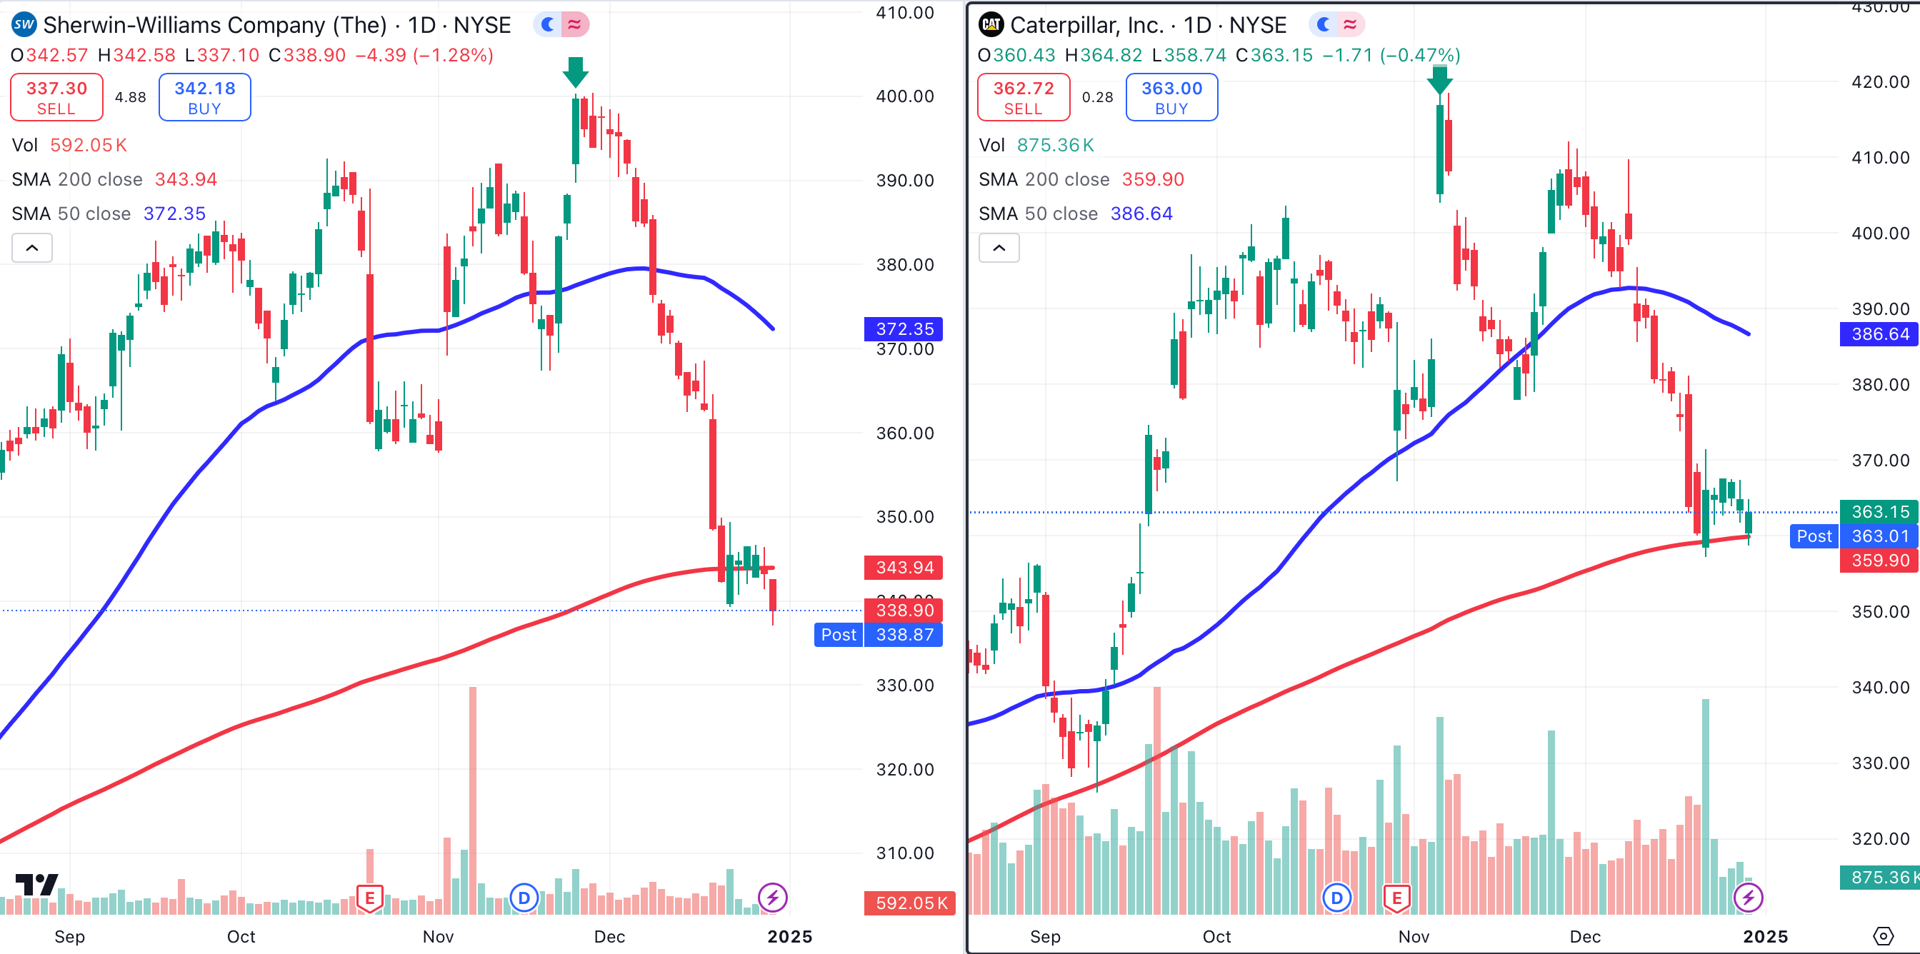
Construction equipment giant Caterpillar CAT (right chart) closed at an all-time high on November 5 (green arrow). This stock has lost its 50-day MA (blue) and is barely hanging on to its 200-day MA (red).
It would be easy to draw the conclusion that a simultaneous swoon in both Sherwin-Williams and Caterpillar is sending a negative signal about the construction and/or housing markets. That's the easy answer, and although the easy answer is often correct, there is more to this story.
This is more likely a negative signal for the global economy, as both U.S.-based companies have significant overseas revenues. The persistently strong U.S. dollar could be weighing these names down.
Cleveland-based Sherwin-Williams receives 57% of its revenue from a business segment it calls "The Americas."
At the time of publication, Ponsi had no positions in any securities mentioned.